Fig. 1
Download original image
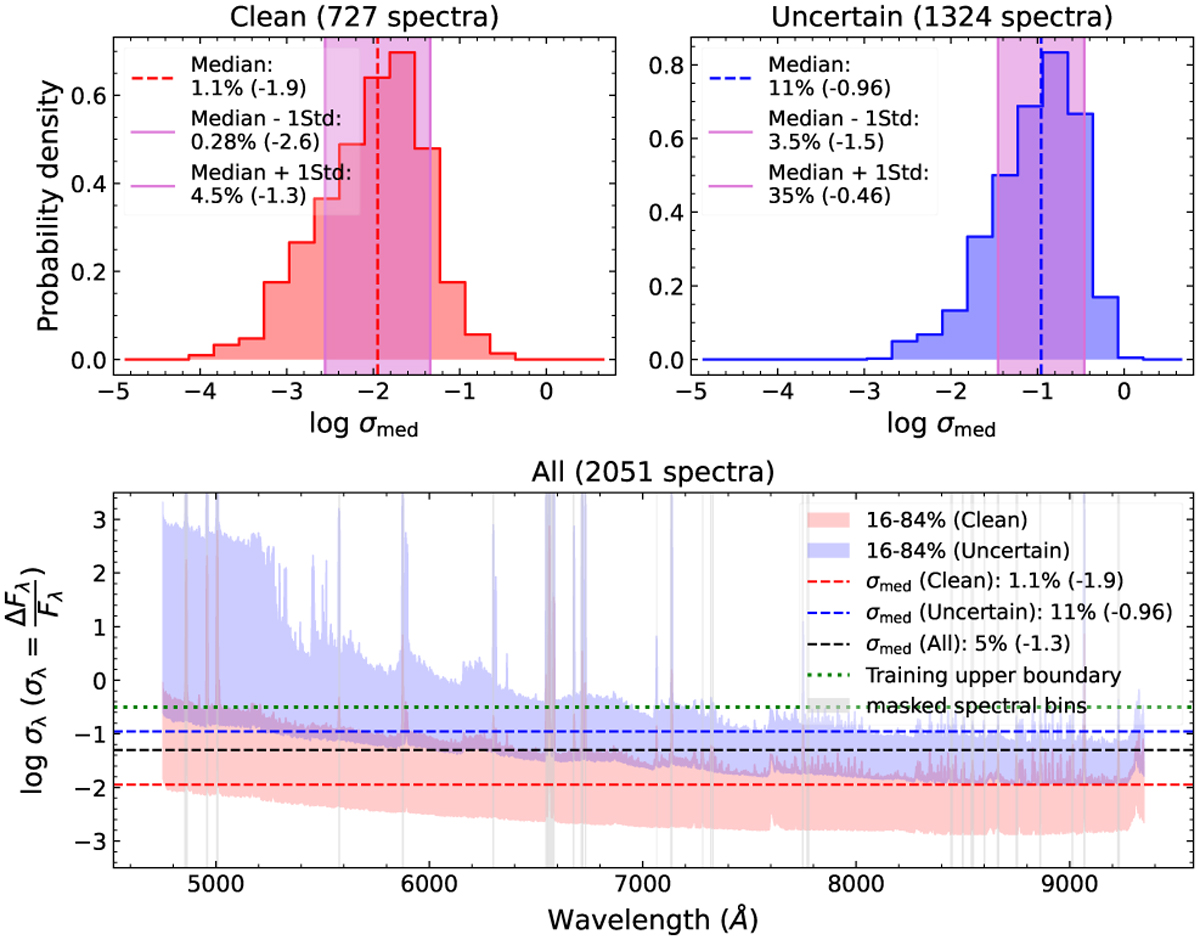
Upper panels: histograms of median relative flux error (σmed) for the spectra in the Clean samples (left) and the Uncertain samples (right). Dashed lines and purple shaded areas indicate the median values and ±1 standard deviations of the distributions. Lower panel: distribution of relative flux error at each spectral bin (σλ = ΔFlux(λ)/Flux(λ)) for the Clean (red) and Uncertain (blue) groups. The shaded areas indicate the interquantile ranges from 16% to 84%. The red and blue dashed lines show the median of σmed for each group as shown in the upper panels and the black dashed line shows the median σmed for all 2051 spectra. The green dotted line indicates the upper boundary of the training range (log σ = -0.5) of our cINN. The narrow grey-shaded vertical areas indicate the masked spectral bins not used in our network due to the presence of emission lines.
Current usage metrics show cumulative count of Article Views (full-text article views including HTML views, PDF and ePub downloads, according to the available data) and Abstracts Views on Vision4Press platform.
Data correspond to usage on the plateform after 2015. The current usage metrics is available 48-96 hours after online publication and is updated daily on week days.
Initial download of the metrics may take a while.