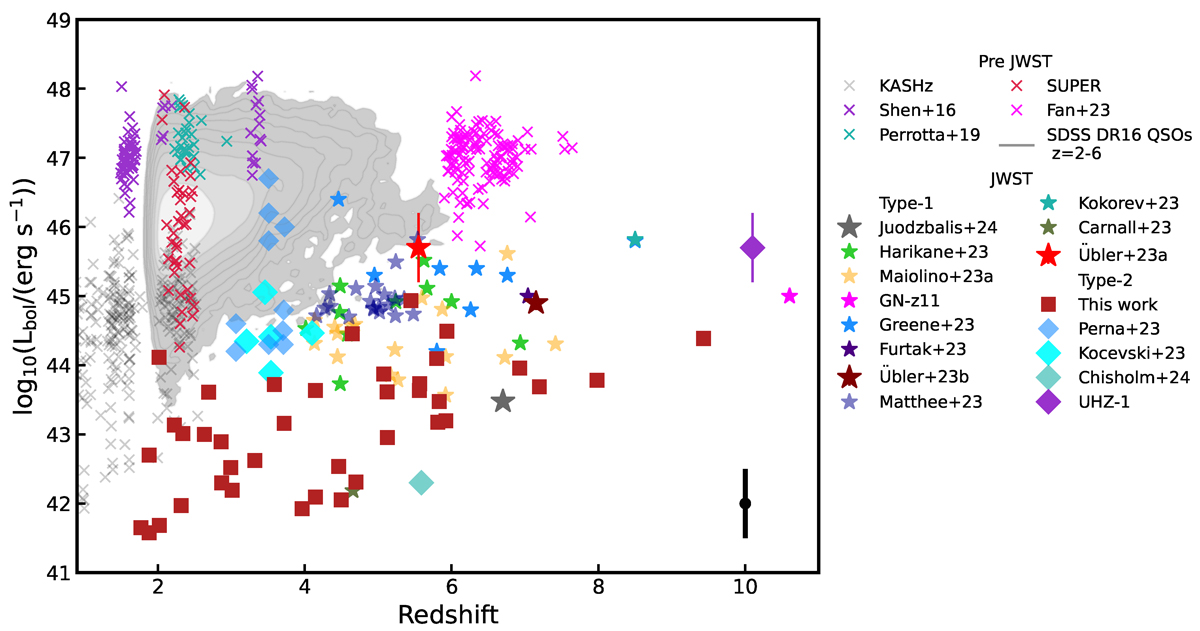
Fig. 8.
Download original image
Bolometric luminosity versus redshift for our objects, plotted as red diamonds. Our bolometric luminosities are estimated from dust-corrected narrow emission lines and should be treated as upper limits. The black point in the bottom right corner shows the systematic uncertainty on the bolometric luminosity for Type-2 AGN. Systematic uncertainties are dominating our measurements. We compare our sample with previous JWST type-1 AGN (various coloured stars and diamonds; Bogdán et al. 2024; Carnall et al. 2023b; Kocevski et al. 2023; Kokorev et al. 2023; Furtak et al. 2024; Goulding et al. 2023; Maiolino et al. 2024a,b; Matthee et al. 2024; Übler et al. 2023; Chisholm et al. 2024), AGN from the KASHz and SUPER surveys at Cosmic Noon (grey and red crosses; Harrison et al. 2016; Kakkad et al. 2020) and QSOs samples across redshifts: SDSS QSOs (z = 2 − 6, grey shaded region; Wu & Shen 2022), extremely red quasars (blue-green crosses; Perrotta et al. 2019), blue QSOs (purple crosses; Shen 2016) and compilation of EoR QSOs (magenta crosses; Fan et al. 2023).
Current usage metrics show cumulative count of Article Views (full-text article views including HTML views, PDF and ePub downloads, according to the available data) and Abstracts Views on Vision4Press platform.
Data correspond to usage on the plateform after 2015. The current usage metrics is available 48-96 hours after online publication and is updated daily on week days.
Initial download of the metrics may take a while.