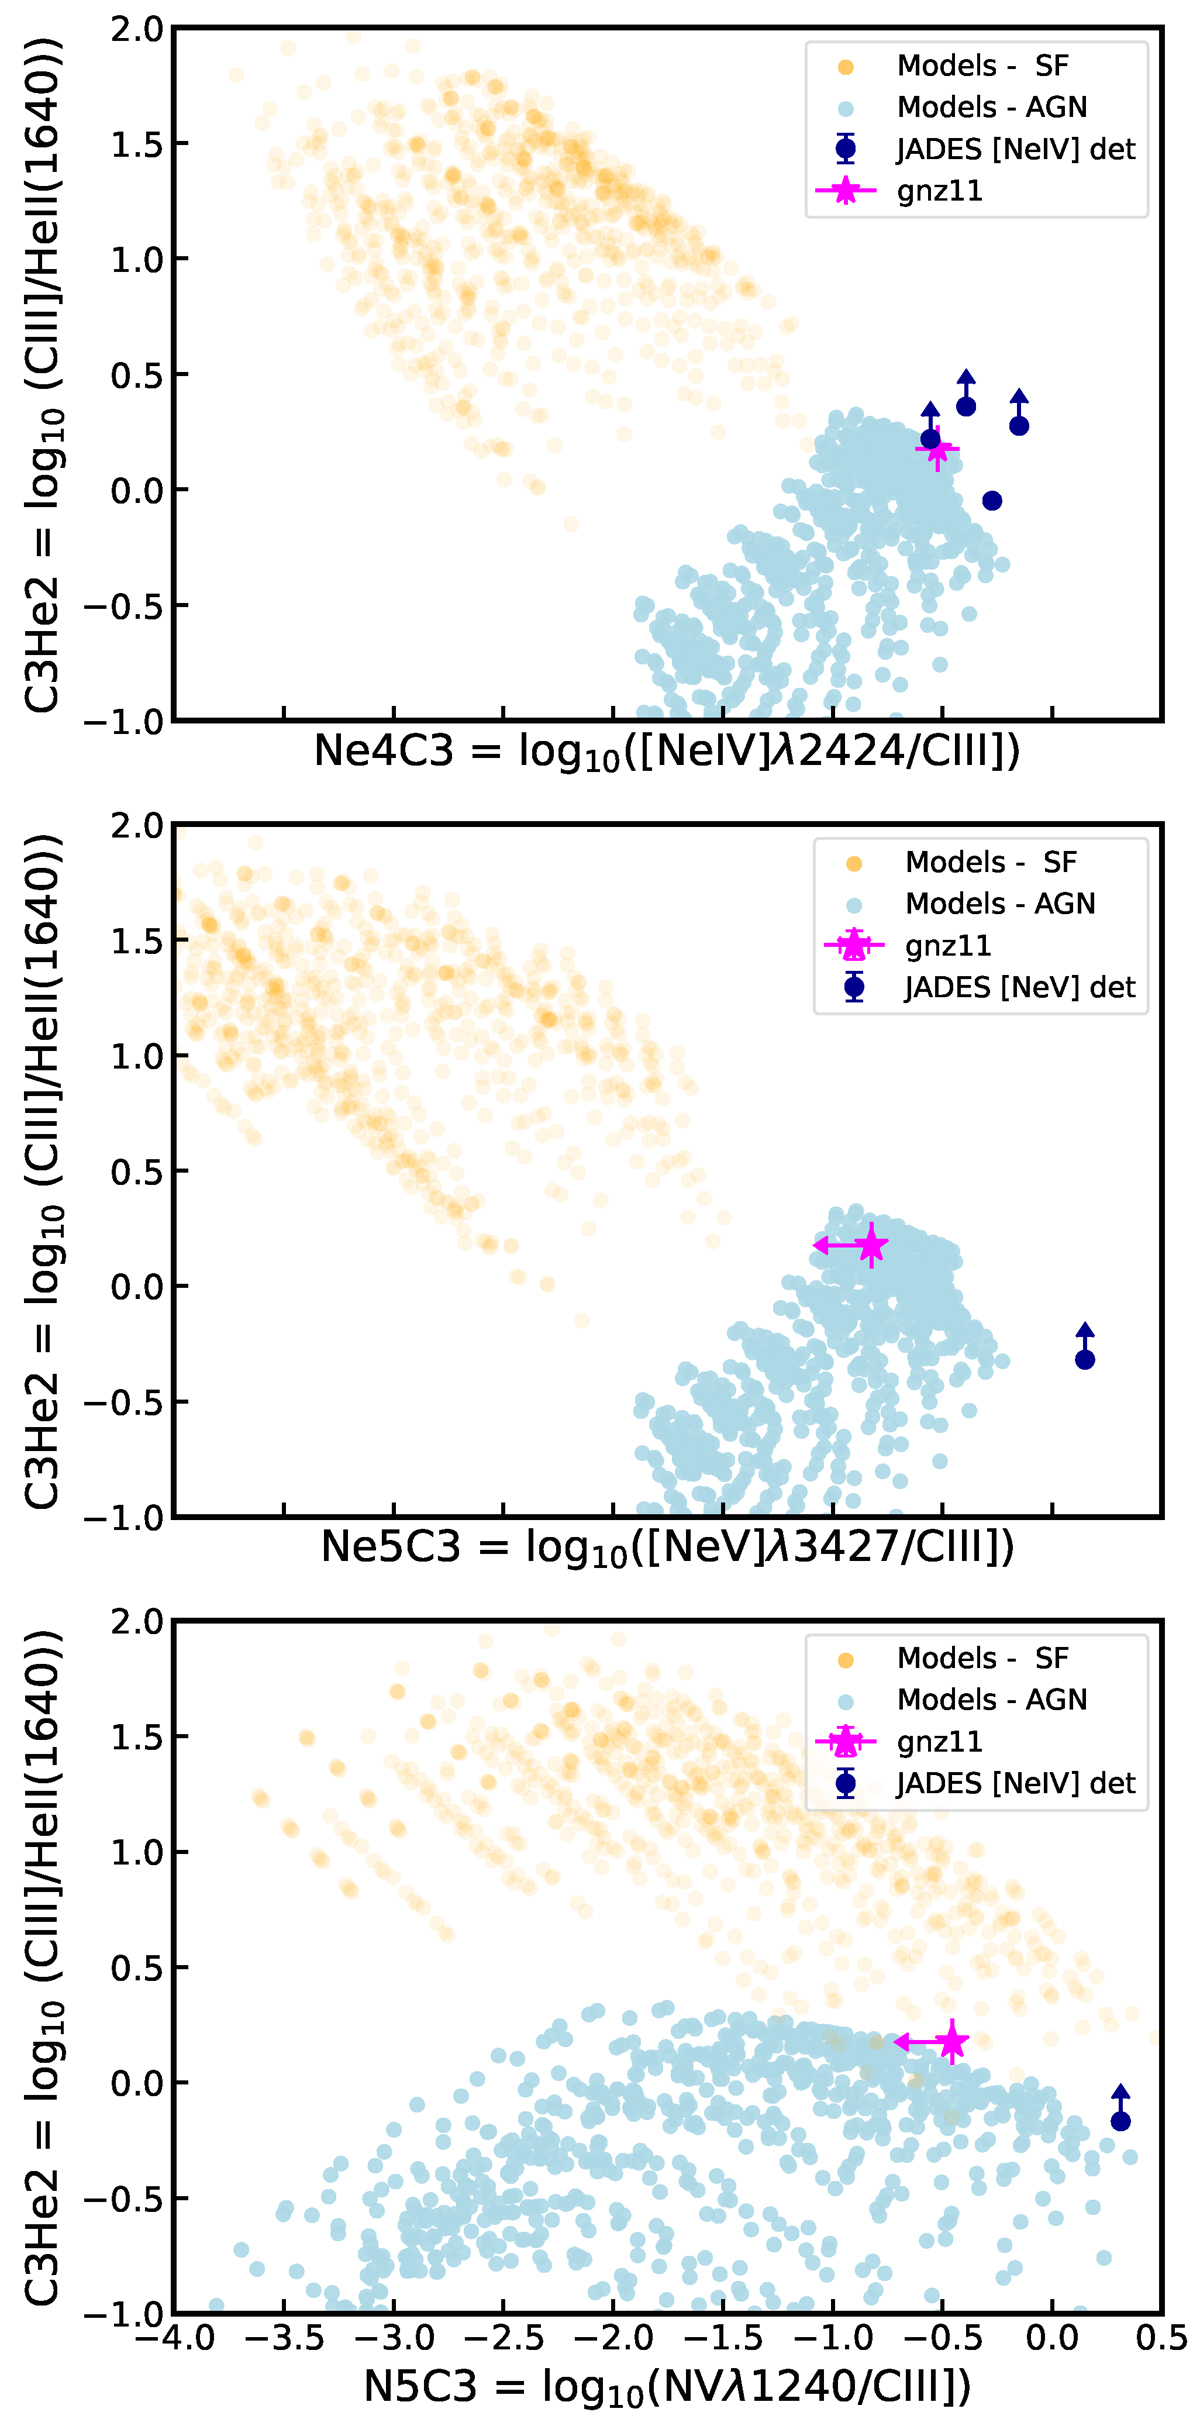
Fig. 5.
Download original image
Emission line diagnostics plot for UV high ionisation lines. Top panel: C3He2 versus [Ne IV] λ2424/C III], Middle Panel: C3He2 versus [Ne V] λ3427/C III] diagnostic diagram, Bottom panel: C3He2 versus N V λ1240/C III]. We plot our objects detected in high ionisation lines as blue points. The yellow and light blue points show star forming and AGN from photo-ionisation models from Feltre et al. (2016), Gutkin et al. (2016) (see Sect. 2.4). We highlight the emission line ratios of GN-z11 (Maiolino et al. 2024a) as the magenta star.
Current usage metrics show cumulative count of Article Views (full-text article views including HTML views, PDF and ePub downloads, according to the available data) and Abstracts Views on Vision4Press platform.
Data correspond to usage on the plateform after 2015. The current usage metrics is available 48-96 hours after online publication and is updated daily on week days.
Initial download of the metrics may take a while.