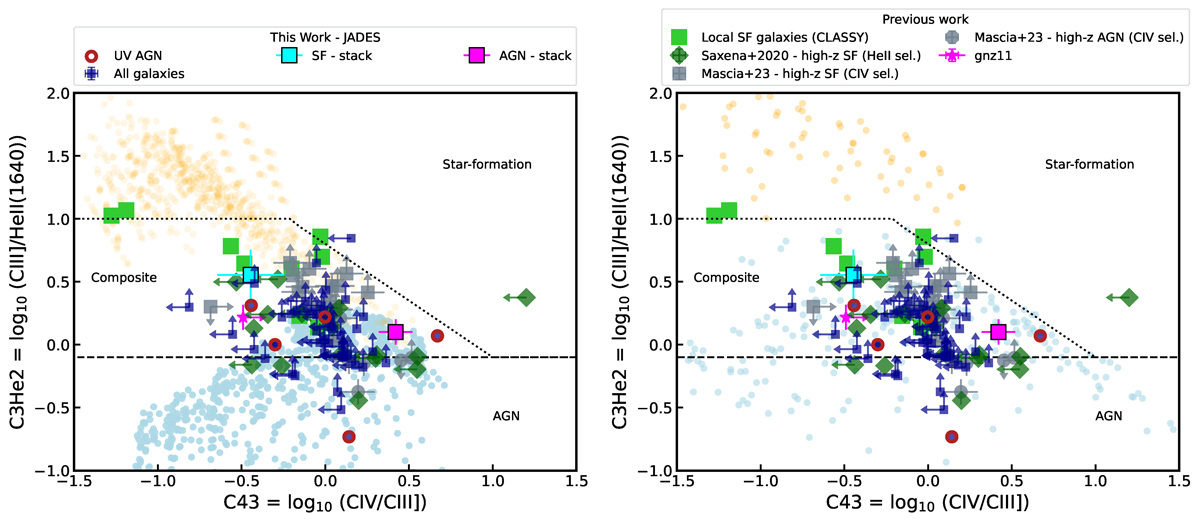
Fig. 4.
Download original image
Diagnostics diagram of C III]/He IIλ1640 versus C IV/C III] (CHe2-C43). We plot our sample as blue squares. The left and right plots show ionisation models from Feltre et al. (2016), Gutkin et al. (2016) and Nakajima & Maiolino (2022), respectively, as yellow and light blue points (see Sect. 2.4). The green diamonds show He IIλ1640 detection from the VANDELS survey (Saxena et al. 2020), and all C IV detections from Mascia et al. (2023) as grey colour with squares and circles representing SF and AGN, respectively. The green squares show local analogues of high-redshift galaxies (from CLASSY survey; Mingozzi et al. 2024). We also show the black dashed and dotted demarcation lines between AGN, star-forming galaxies and composite line ratios from Hirschmann et al. (2023). Overall, we select five AGN on this diagram and we highlight these with a red circle. The magenta and cyan squares show a stacked spectrum for AGN and star-forming galaxies (see Sect 4.1).
Current usage metrics show cumulative count of Article Views (full-text article views including HTML views, PDF and ePub downloads, according to the available data) and Abstracts Views on Vision4Press platform.
Data correspond to usage on the plateform after 2015. The current usage metrics is available 48-96 hours after online publication and is updated daily on week days.
Initial download of the metrics may take a while.