Open Access
Fig. A.1.
Download original image
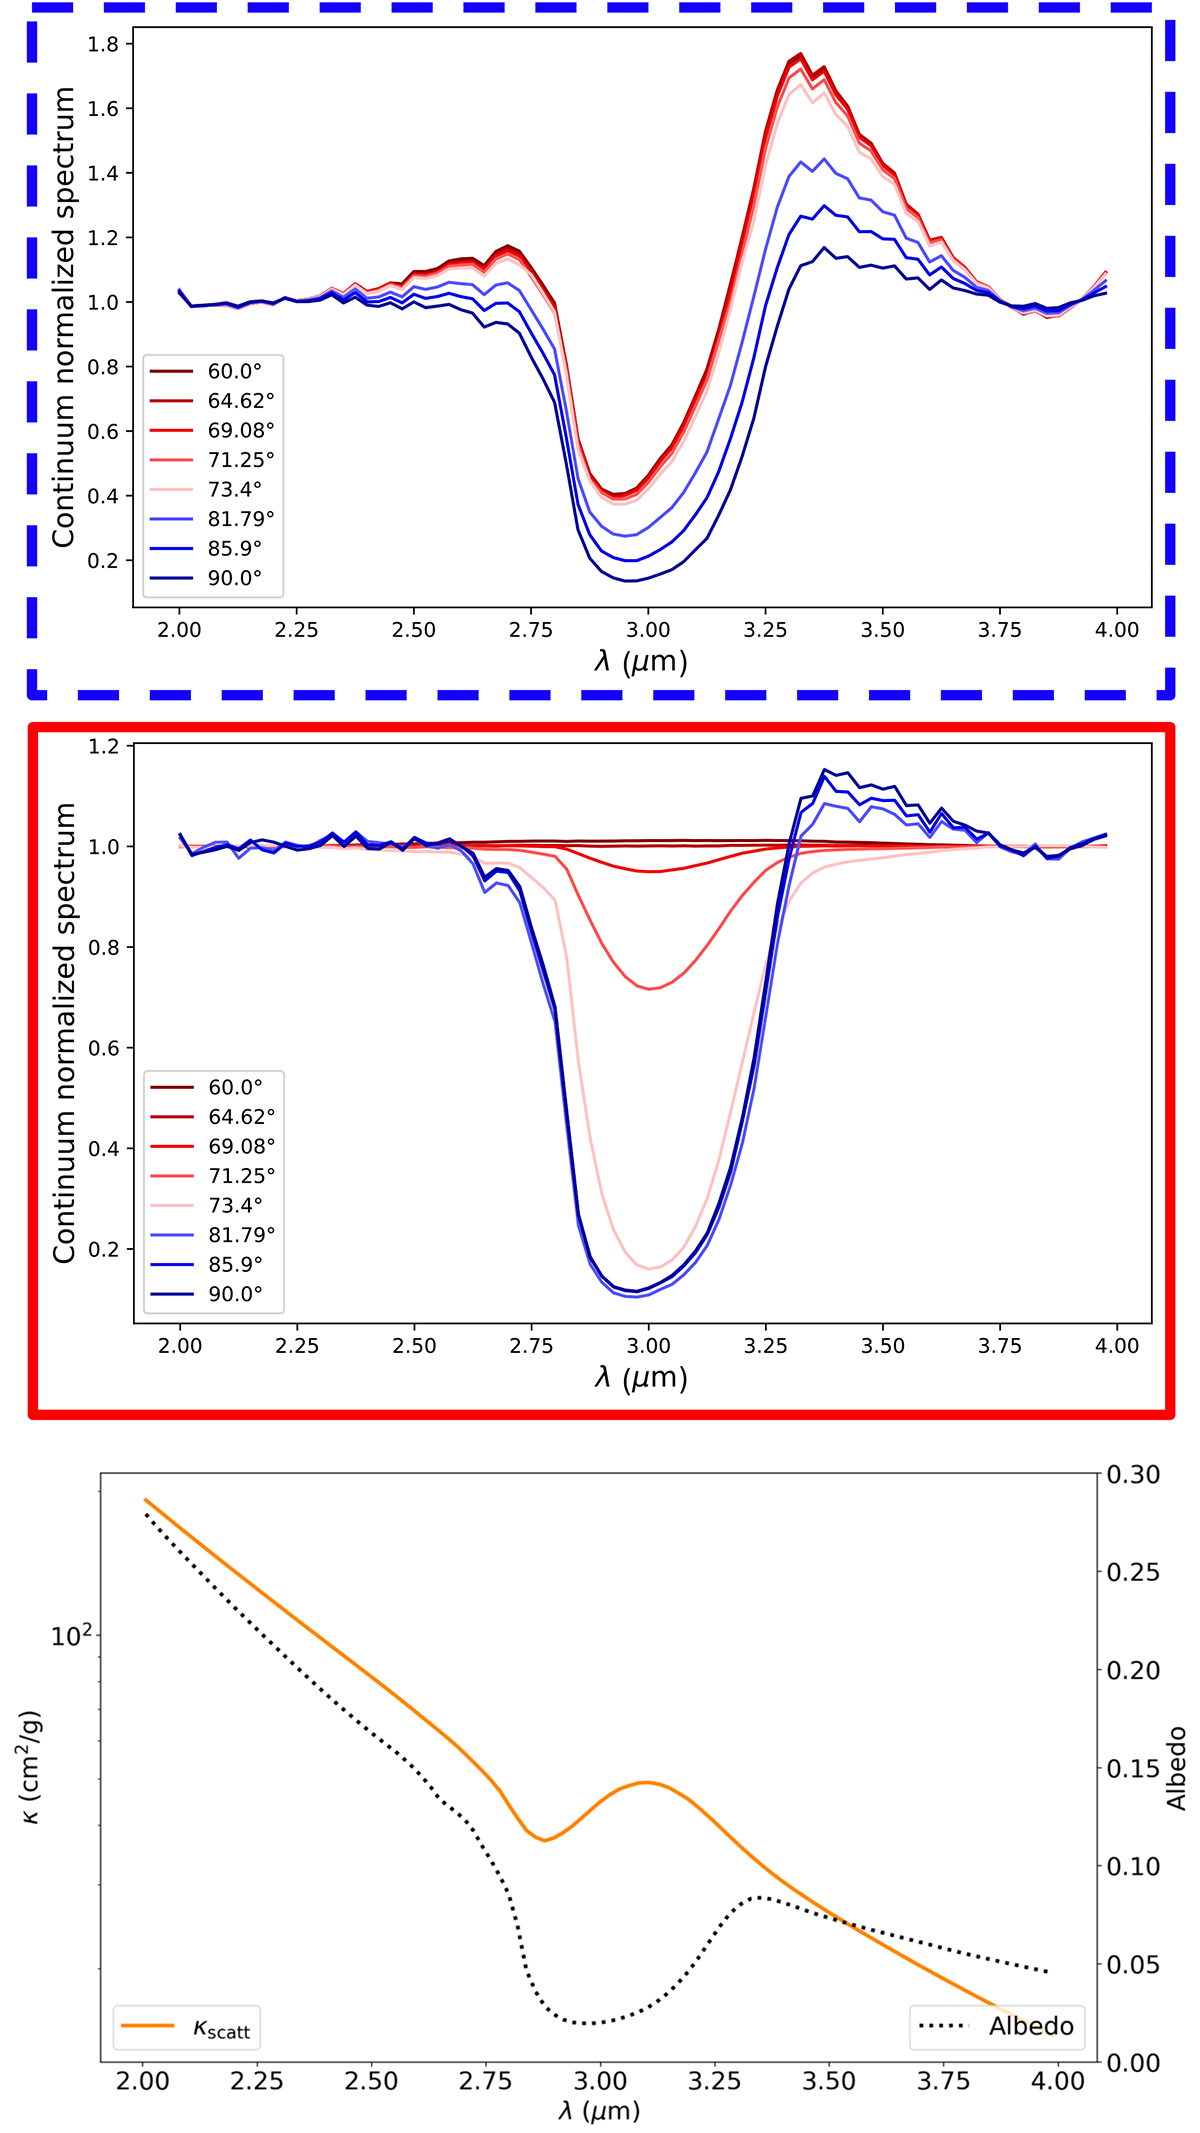
Synthetic spectra (top and middle panels) as well as opacities and albedo curves (bottom panel) of an alternative model at different inclinations (between 60°and 90°). The top panel corresponds to the edge of the disk whereas the middle panel corresponds to the central point source.
Current usage metrics show cumulative count of Article Views (full-text article views including HTML views, PDF and ePub downloads, according to the available data) and Abstracts Views on Vision4Press platform.
Data correspond to usage on the plateform after 2015. The current usage metrics is available 48-96 hours after online publication and is updated daily on week days.
Initial download of the metrics may take a while.