Open Access
Fig. 3.
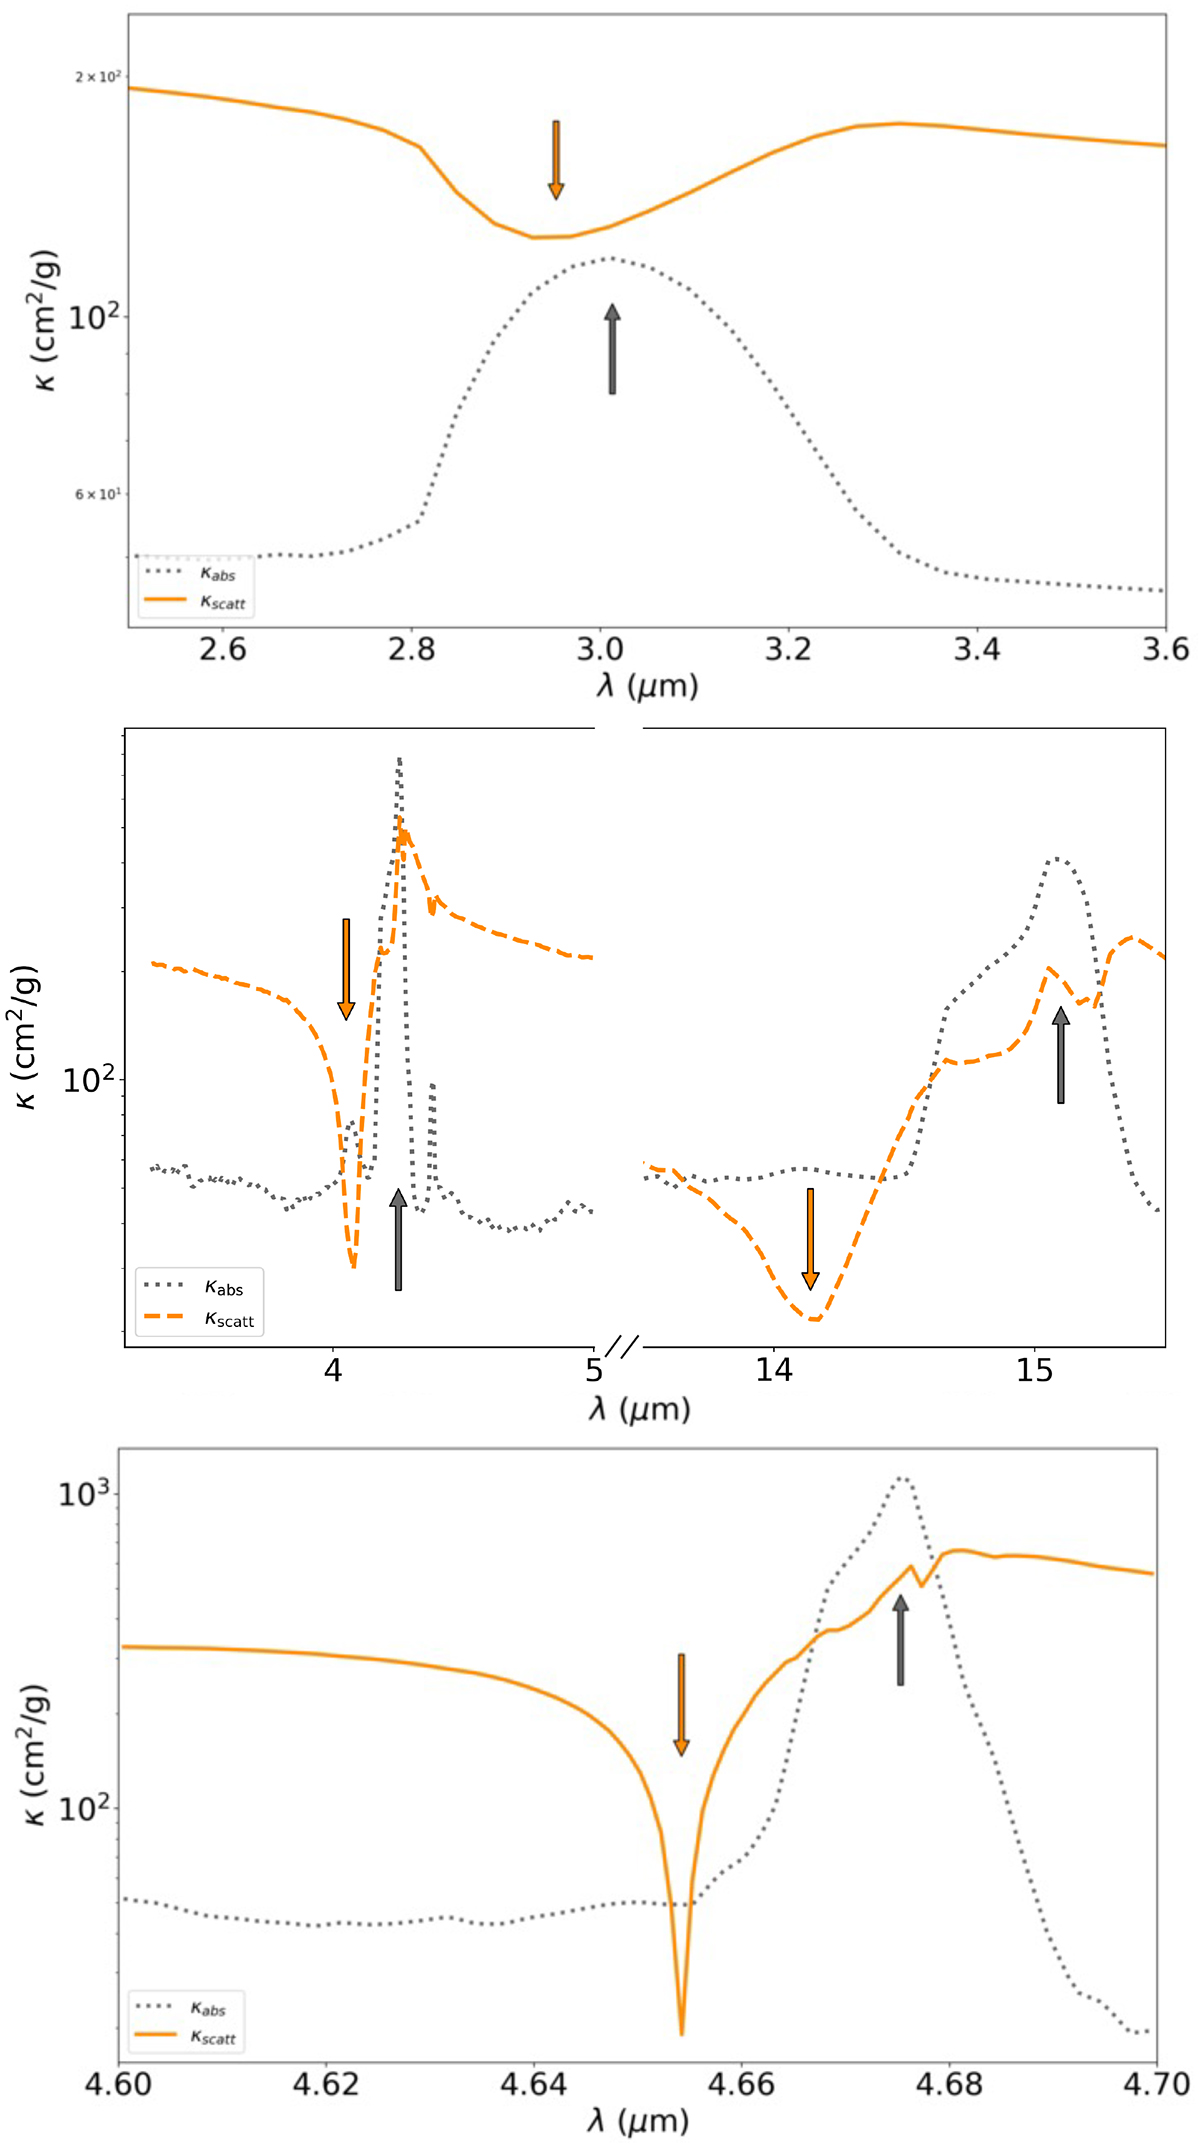
Download original image
Scattering and absorption opacities of the dust populations in selected wavelengths regions. The top panel corresponds to the dust population used in the model presented in Section 2, whereas the middle and bottom panels correspond to pure CO2 (Gerakines & Hudson 2020) and CO ices (Palumbo et al. 2006), respectively.
Current usage metrics show cumulative count of Article Views (full-text article views including HTML views, PDF and ePub downloads, according to the available data) and Abstracts Views on Vision4Press platform.
Data correspond to usage on the plateform after 2015. The current usage metrics is available 48-96 hours after online publication and is updated daily on week days.
Initial download of the metrics may take a while.