Fig. 2.
Download original image
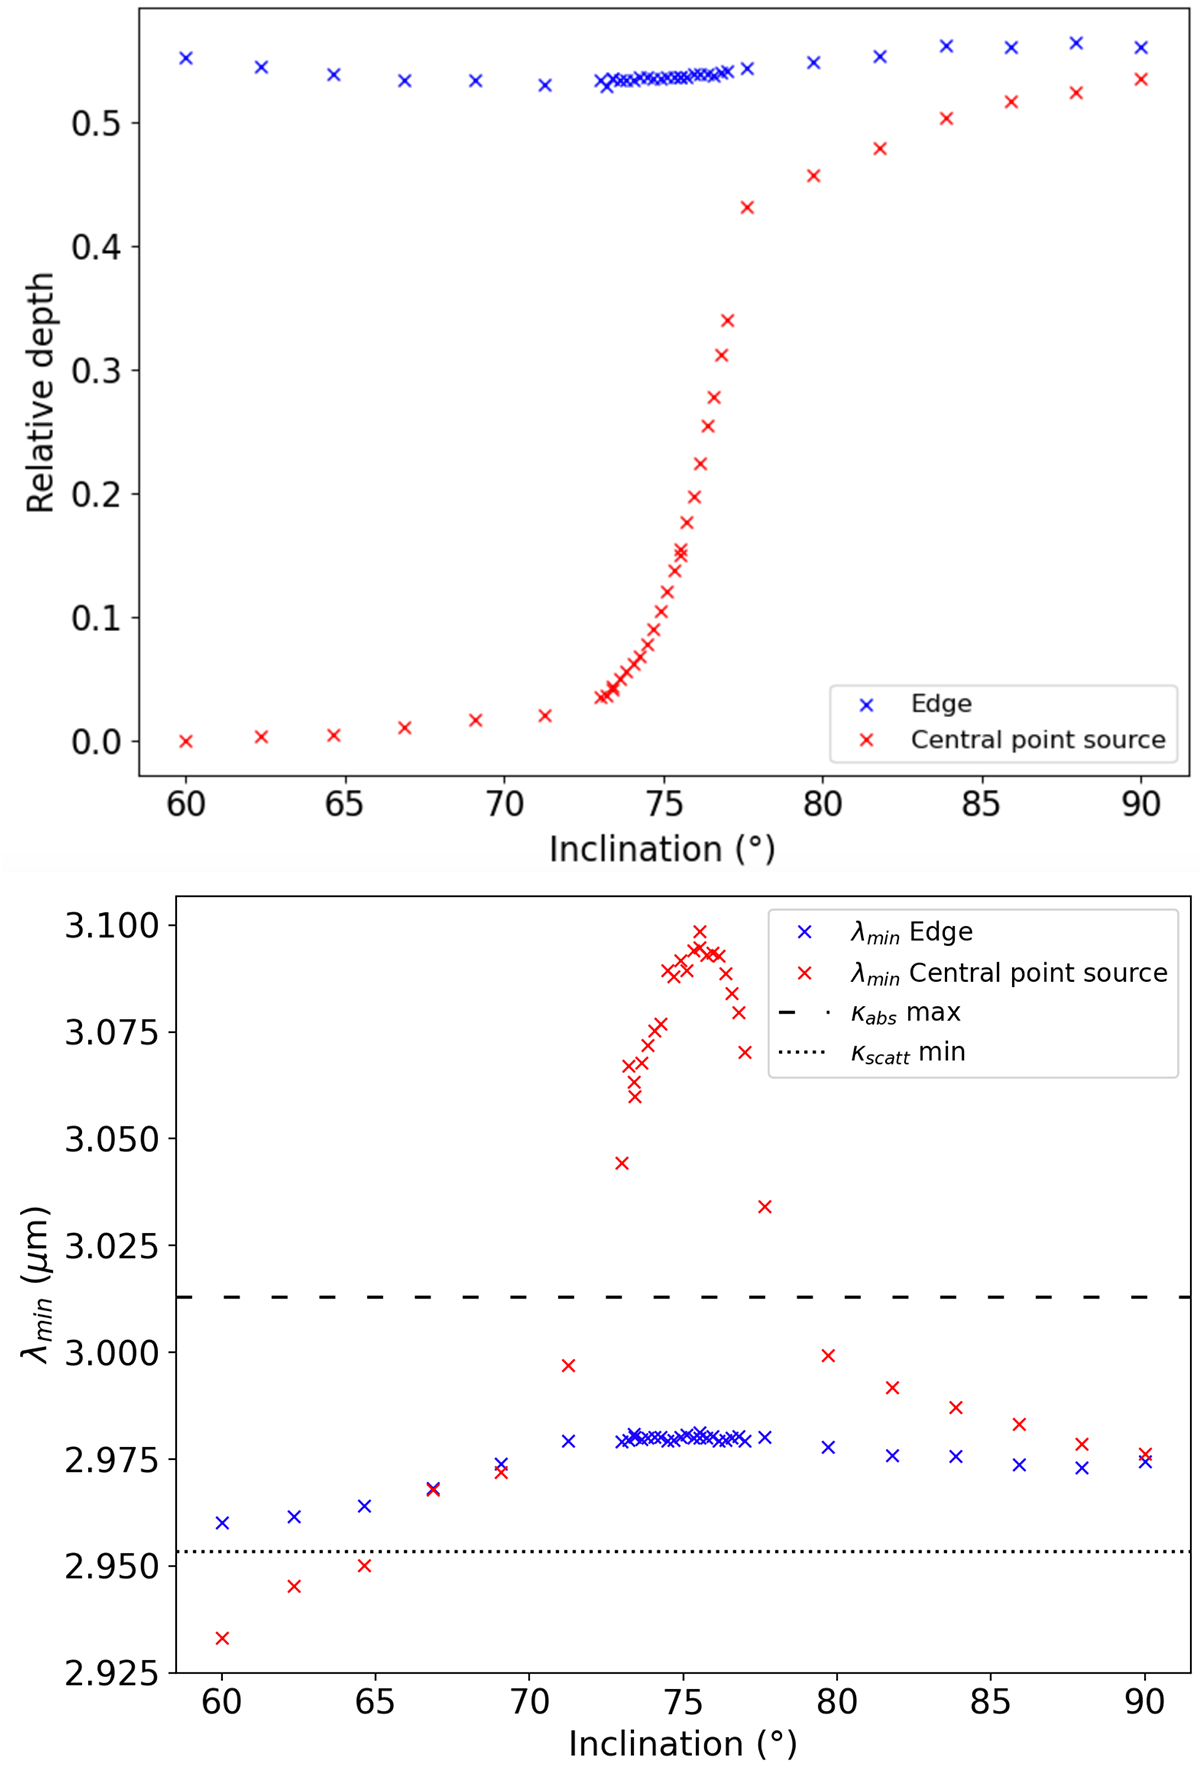
Relative depth and wavelength of band minimum (top and bottom panels, respectively) of the water-ice bands as a function of inclination. The dashed and dotted black lines in the bottom panel represent the wavelengths at which κabs and κscatt reach their minimum and maximum value across the water-ice band, respectively (see Fig. 3).
Current usage metrics show cumulative count of Article Views (full-text article views including HTML views, PDF and ePub downloads, according to the available data) and Abstracts Views on Vision4Press platform.
Data correspond to usage on the plateform after 2015. The current usage metrics is available 48-96 hours after online publication and is updated daily on week days.
Initial download of the metrics may take a while.