Fig. 9
Download original image
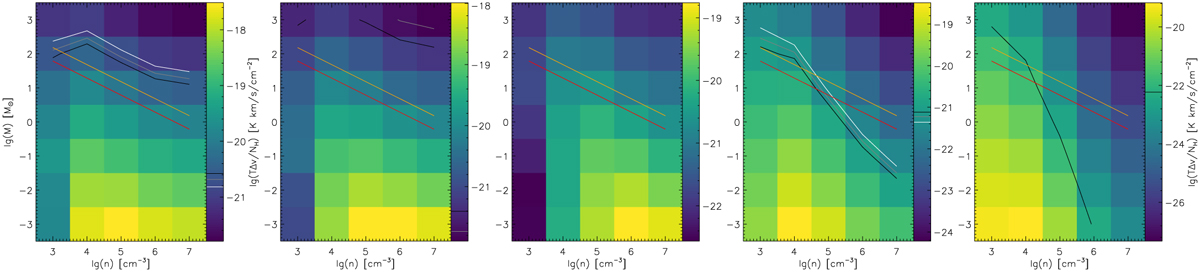
Integrated line intensities predicted by the KOSMA-τ PDR model relative to the column density of the model clumps. The panels from left to right show CO 2−1, 13CO 2−1, C18O 2−1, [C I] 1−0, and [C II]. The white, gray, and black lines indicate the minimum, mean, and maximum of the observed ratio. For [C II], we only have an upper limit. For C18O 2−1, even the maximum falls outside of the covered parameter range and is lower than all displayed values. The red and orange contours indicate the lowest and highest column density in the region obtained from the dust observations.
Current usage metrics show cumulative count of Article Views (full-text article views including HTML views, PDF and ePub downloads, according to the available data) and Abstracts Views on Vision4Press platform.
Data correspond to usage on the plateform after 2015. The current usage metrics is available 48-96 hours after online publication and is updated daily on week days.
Initial download of the metrics may take a while.