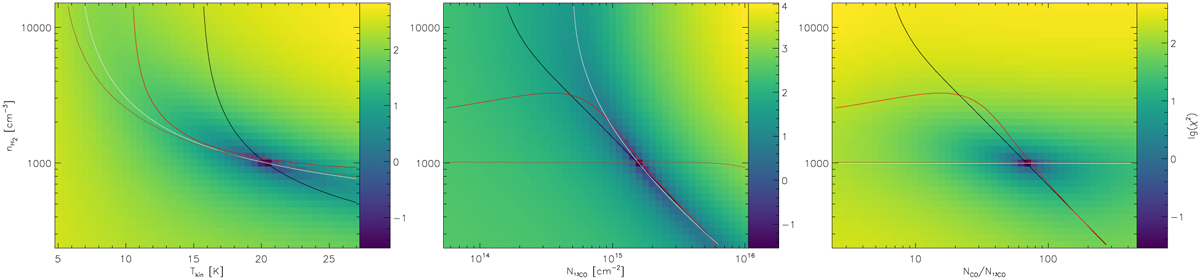
Fig. 8
Download original image
Two-dimensional cuts through the χ2 topology of the RADEX simulation of the observed intensities of the CO 1−0, 2−1 and 13CO 1−0 and 2−1 lines. The χ2 values are given in logarithmic units, so that only the dark blue area indicates a valid fit. All slices are taken through the χ2 minimum. The contour lines show the parameters at which the observed values were matched. The black and white lines show the integrated intensities of CO 2−1 and 13CO 2−1, and the red and brown lines show the ratios of CO 1−0/CO 2−1 and 13CO 1−0/13CO 2−1.
Current usage metrics show cumulative count of Article Views (full-text article views including HTML views, PDF and ePub downloads, according to the available data) and Abstracts Views on Vision4Press platform.
Data correspond to usage on the plateform after 2015. The current usage metrics is available 48-96 hours after online publication and is updated daily on week days.
Initial download of the metrics may take a while.