Fig. 7
Download original image
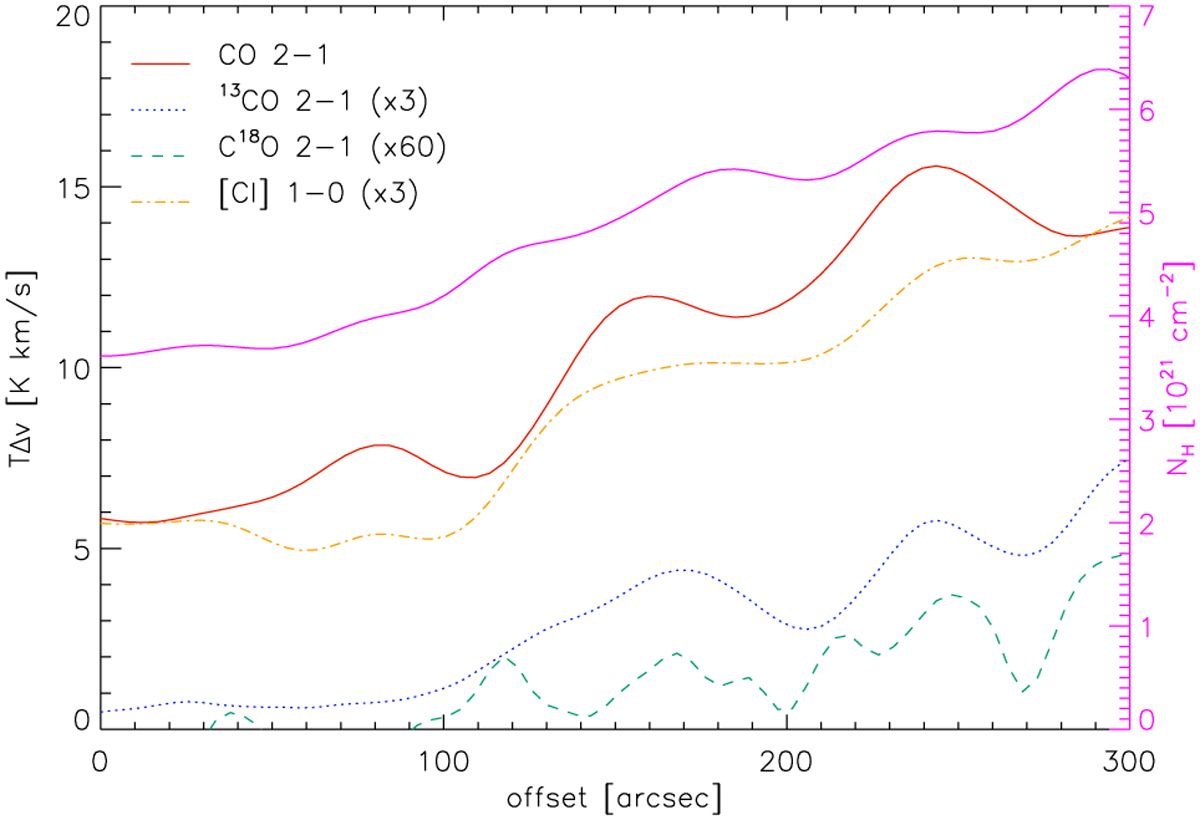
Comparison of the line-integrated intensities of [C I] and the CO isotopologs (left axis) with the column density along the strip (right axis, purple). All data are averaged perpendicular to the strip direction.
Current usage metrics show cumulative count of Article Views (full-text article views including HTML views, PDF and ePub downloads, according to the available data) and Abstracts Views on Vision4Press platform.
Data correspond to usage on the plateform after 2015. The current usage metrics is available 48-96 hours after online publication and is updated daily on week days.
Initial download of the metrics may take a while.