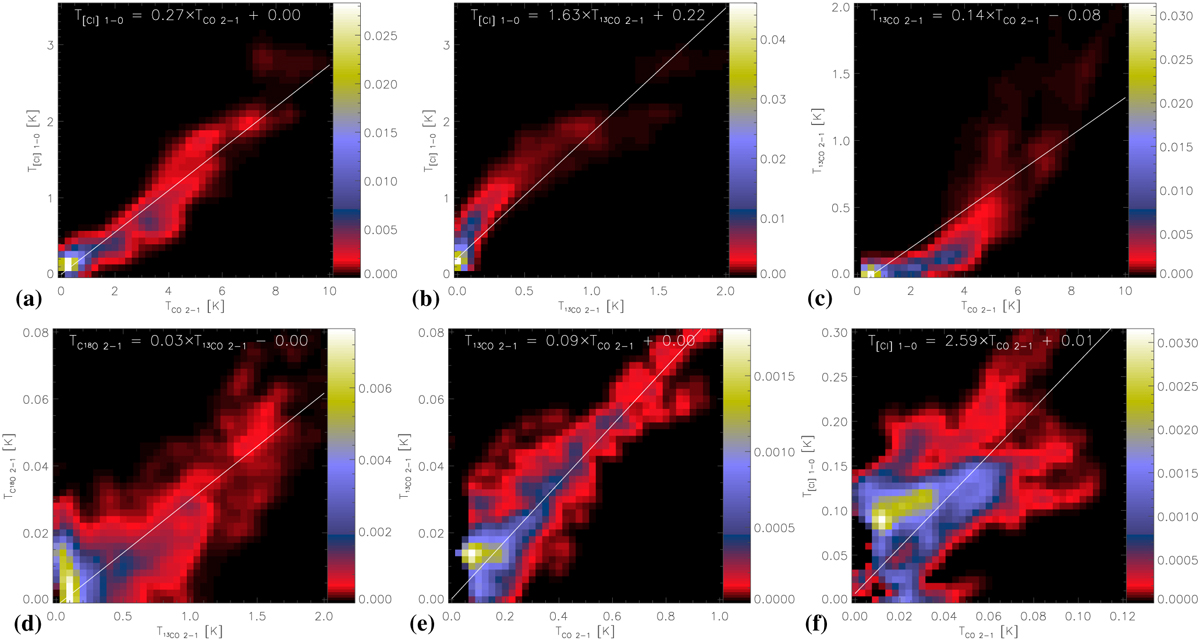
Fig. 6
Download original image
Distribution of line intensities based on a comparison of different transitions at the same spatial-spectral pixel. The panels compare (a) CO 2−1 to [CI] 1−0, (b) 13CO 2−1 to [CI] 1−0 (c) CO 2−1 to 13CO 2−1, (d) 13CO 2−1 to C18O 2−1, for the 14 km s−1 component, i.e., all spectral pixels in the line window from 11 to 17 km s−1, (e) CO 2−1 to 13CO 2−1 in the 36 km s−1 component (340–38 km s−1), and (f) CO 2−1 to [CI] 1−0 for the 20 km s−1 component (18–22 km s−1). The noise distribution determined outside of the spectral window is subtracted to emphasize the relation for true emission only. The white line and the equation at the top show the results of a linear fit to all noise-weighted points forming the distributions.
Current usage metrics show cumulative count of Article Views (full-text article views including HTML views, PDF and ePub downloads, according to the available data) and Abstracts Views on Vision4Press platform.
Data correspond to usage on the plateform after 2015. The current usage metrics is available 48-96 hours after online publication and is updated daily on week days.
Initial download of the metrics may take a while.