Fig. 4
Download original image
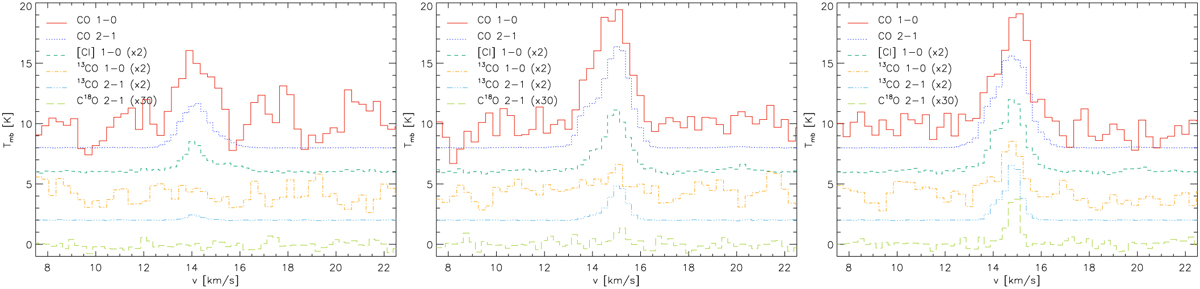
Spectra measured at three selected positions. The left plot shows the zero-position of the map, the central plot shows the peak of the 20 km s−1 component, and the right plot shows the central pixel at the bright end of the strip (see Fig. 7). The individual spectra have been shifted vertically by 2 K relative to each other to improve the visibility. As the 36 km s−1 component is not detected above the noise level for these three positions, the plotted spectral range is limited to the other two velocity components.
Current usage metrics show cumulative count of Article Views (full-text article views including HTML views, PDF and ePub downloads, according to the available data) and Abstracts Views on Vision4Press platform.
Data correspond to usage on the plateform after 2015. The current usage metrics is available 48-96 hours after online publication and is updated daily on week days.
Initial download of the metrics may take a while.