Fig. 2
Download original image
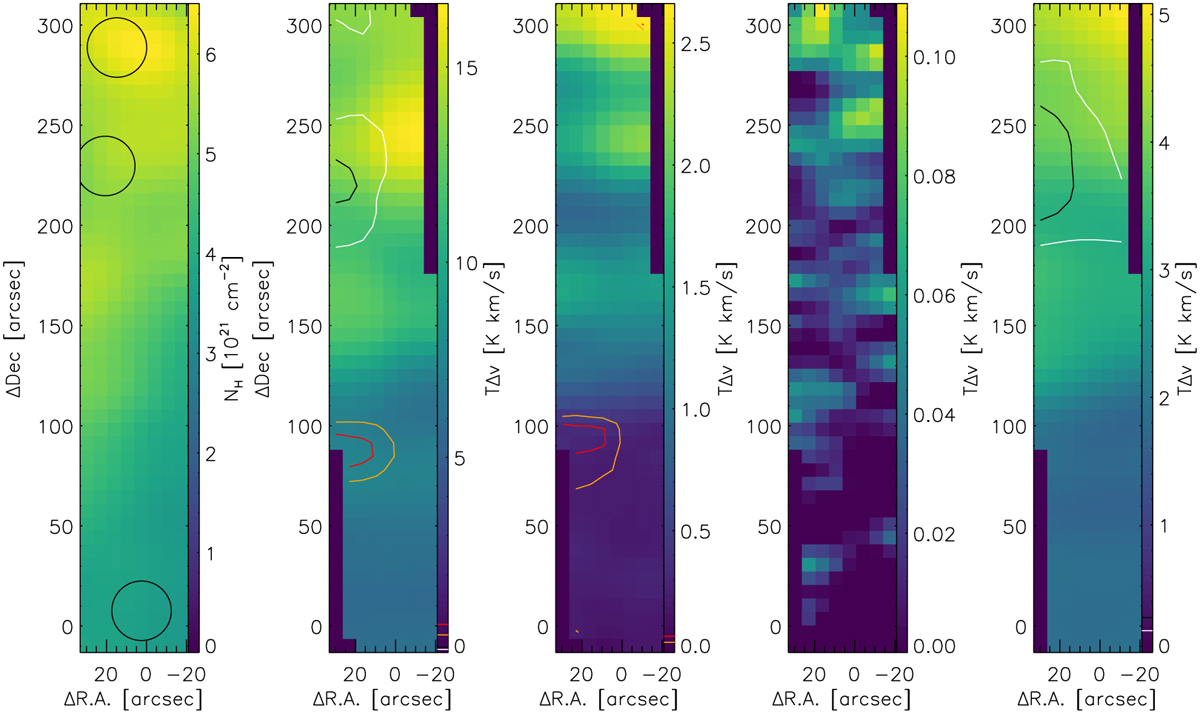
Integrated maps of the observed strip. The left map shows the gas column density derived from the Hi-GAL observations. The circles there indicate the position and effective beam size of the spectra discussed in Fig. 4. The following maps give the line-integrated intensities of the CO 2−1, 13CO 2−1, C18O 2−1, and [C I] 1−0 transitions. The colors represent the integrated intensity for the main velocity component from 11 to 17 km s−1. The black and white contours show the integral over the component from 18 to 22 km s−1, and the orange and red contours show the integral from 34 to 38 km s−1. The zero position in the plots is at RA(J2000) = 7:10:39.8, Dec(J2000) = −11:27:09.
Current usage metrics show cumulative count of Article Views (full-text article views including HTML views, PDF and ePub downloads, according to the available data) and Abstracts Views on Vision4Press platform.
Data correspond to usage on the plateform after 2015. The current usage metrics is available 48-96 hours after online publication and is updated daily on week days.
Initial download of the metrics may take a while.