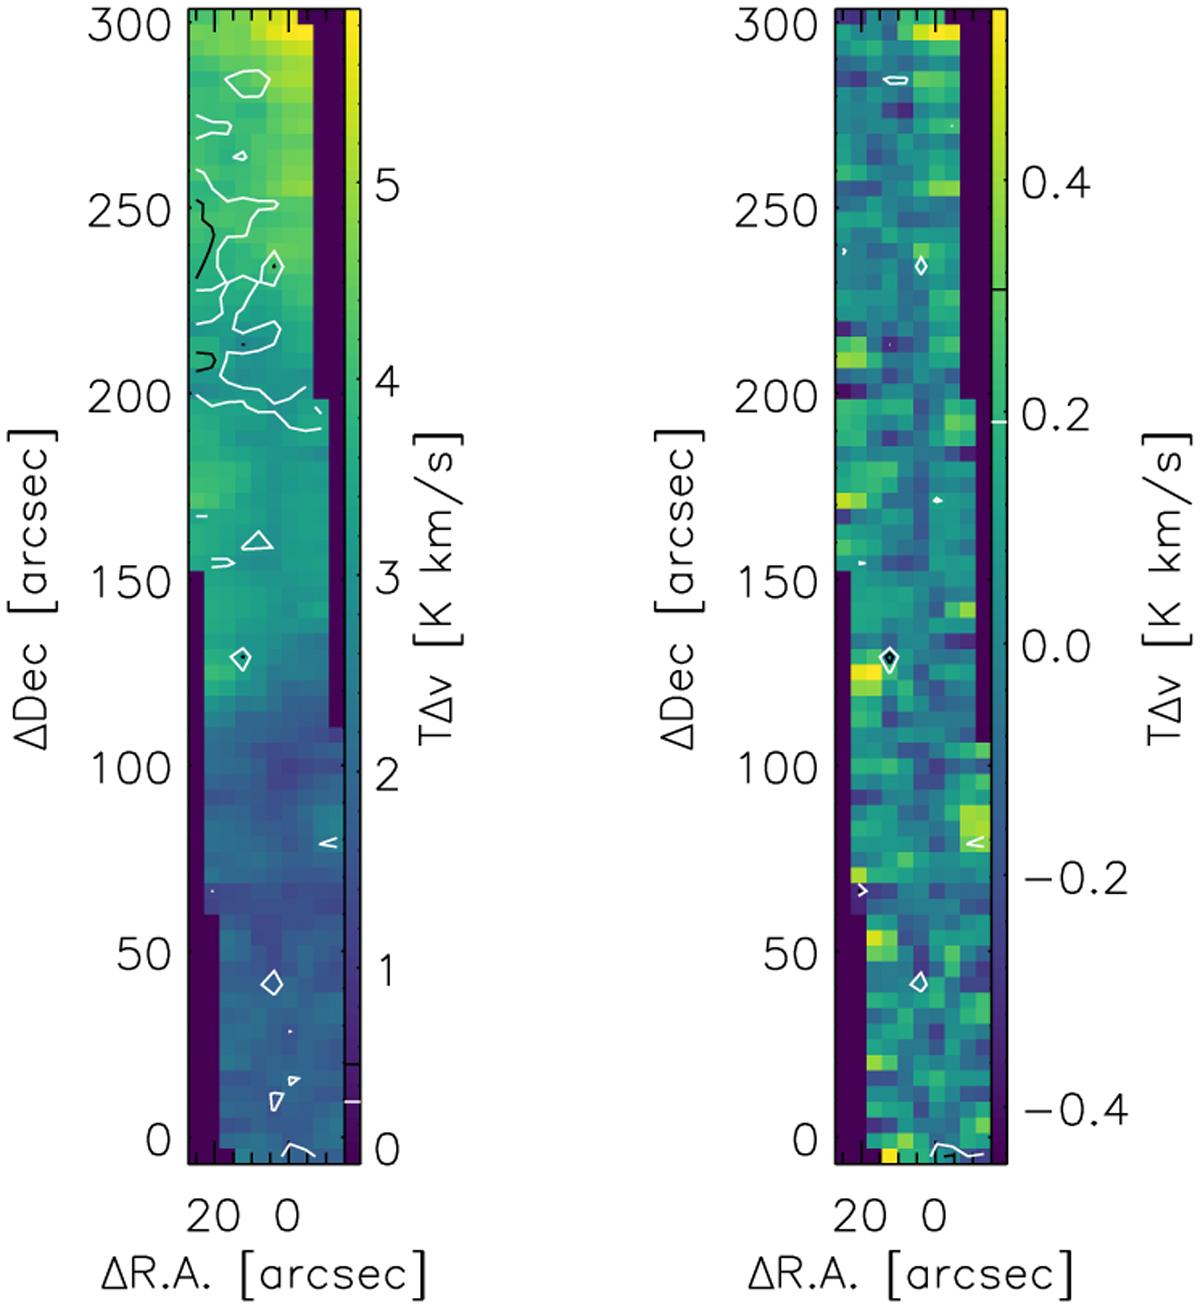
Fig. A.1
Download original image
Integrated [C I] map at a resolution of 14.3 arcsec (left) and difference to the low-resolution map from Fig. 2 (right). Colors give the integrated intensity for the 14 km s−1 component, contours show the 20 km s−1 -component.
Current usage metrics show cumulative count of Article Views (full-text article views including HTML views, PDF and ePub downloads, according to the available data) and Abstracts Views on Vision4Press platform.
Data correspond to usage on the plateform after 2015. The current usage metrics is available 48-96 hours after online publication and is updated daily on week days.
Initial download of the metrics may take a while.