Fig. 10
Download original image
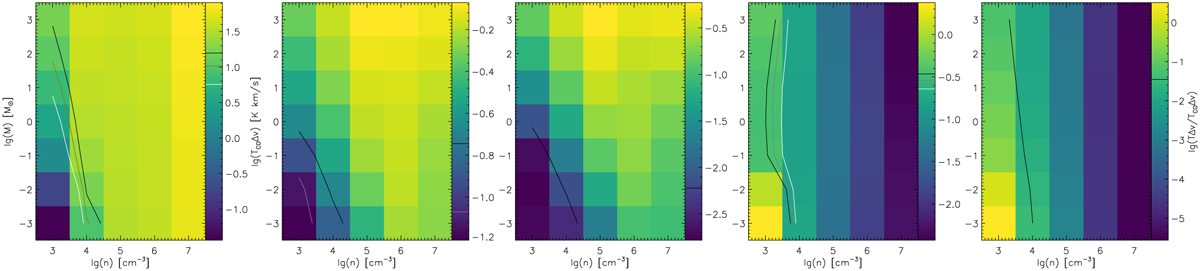
Integrated line intensities predicted by the KOSMA-τ PDR model relative to the CO 2−1 intensity. The left panel shows this CO 2−1 intensity, and the subsequent panels give the ratios for 13CO 2−1, C18O 2−1, [C I] 1−0, and [C II]. The white, gray, and black lines indicate the minimum, mean, and maximum of the observed ratios.
Current usage metrics show cumulative count of Article Views (full-text article views including HTML views, PDF and ePub downloads, according to the available data) and Abstracts Views on Vision4Press platform.
Data correspond to usage on the plateform after 2015. The current usage metrics is available 48-96 hours after online publication and is updated daily on week days.
Initial download of the metrics may take a while.