Fig. 1
Download original image
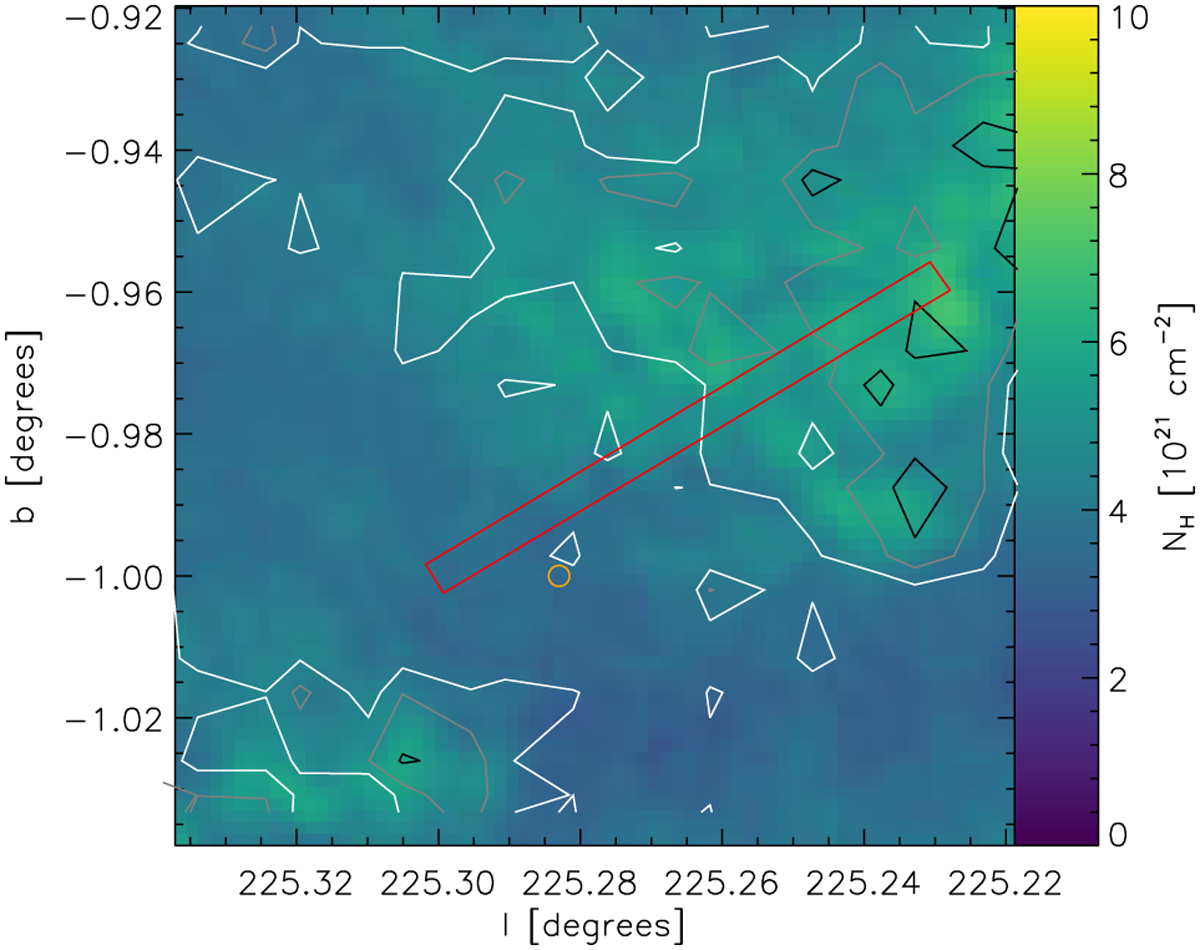
Known structure of the environment of the mapped strip. The colors give the total gas column density derived from the Herschel SPIRE and PACS observations. The contours show the line-integrated intensity of 13CO 1−0 from the Forgotten Quadrant Survey at levels of 1.5 (white), 3.0 (gray), and 4.5 (black) K km s−1. The mapped area is shown as a red rectangle. The orange circle gives the beam and position of the existing single-pointing [C II] observation.
Current usage metrics show cumulative count of Article Views (full-text article views including HTML views, PDF and ePub downloads, according to the available data) and Abstracts Views on Vision4Press platform.
Data correspond to usage on the plateform after 2015. The current usage metrics is available 48-96 hours after online publication and is updated daily on week days.
Initial download of the metrics may take a while.