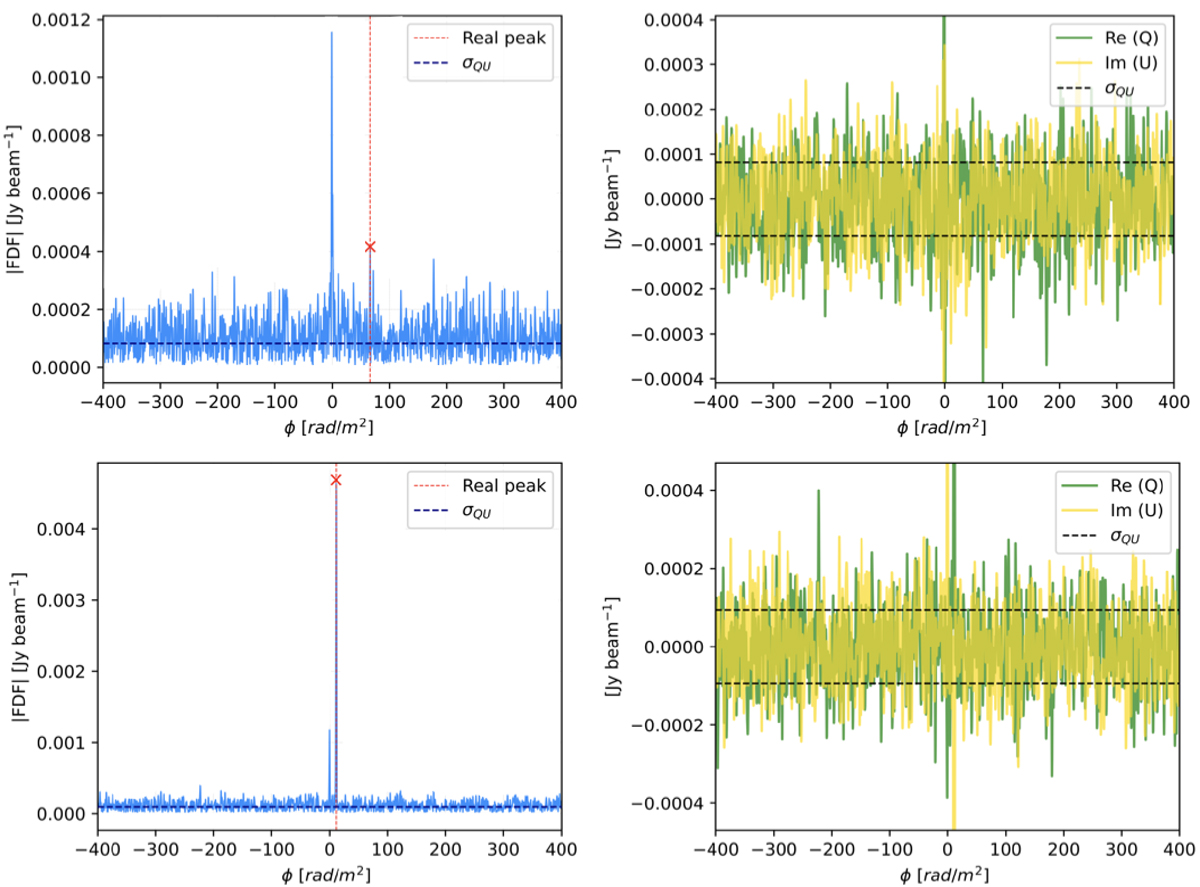
Fig. A.1.
Download original image
Absolute value of the Faraday spectrum (FDF; solid blue line) and the real (Q; solid green line) and imaginary (U; solid yellow line) components of the FDF, for two example polarised source components. The Q,U plots have a restricted range on the y-axis to better visualise the noise. The ‘real’ peak, i.e. the highest signal-to-noise polarised component outside the leakage range, is marked with a red cross. The leakage peak is noticeable in both cases at ϕ ∼ 0 rad m−2. The rms noise (σQU) level is shown as a dashed line. After inspection, the top source at S/N ∼ 8 is excluded, while the bottom source, at S/N ∼ 40 is accepted.
Current usage metrics show cumulative count of Article Views (full-text article views including HTML views, PDF and ePub downloads, according to the available data) and Abstracts Views on Vision4Press platform.
Data correspond to usage on the plateform after 2015. The current usage metrics is available 48-96 hours after online publication and is updated daily on week days.
Initial download of the metrics may take a while.