Open Access
Fig. 2.
Download original image
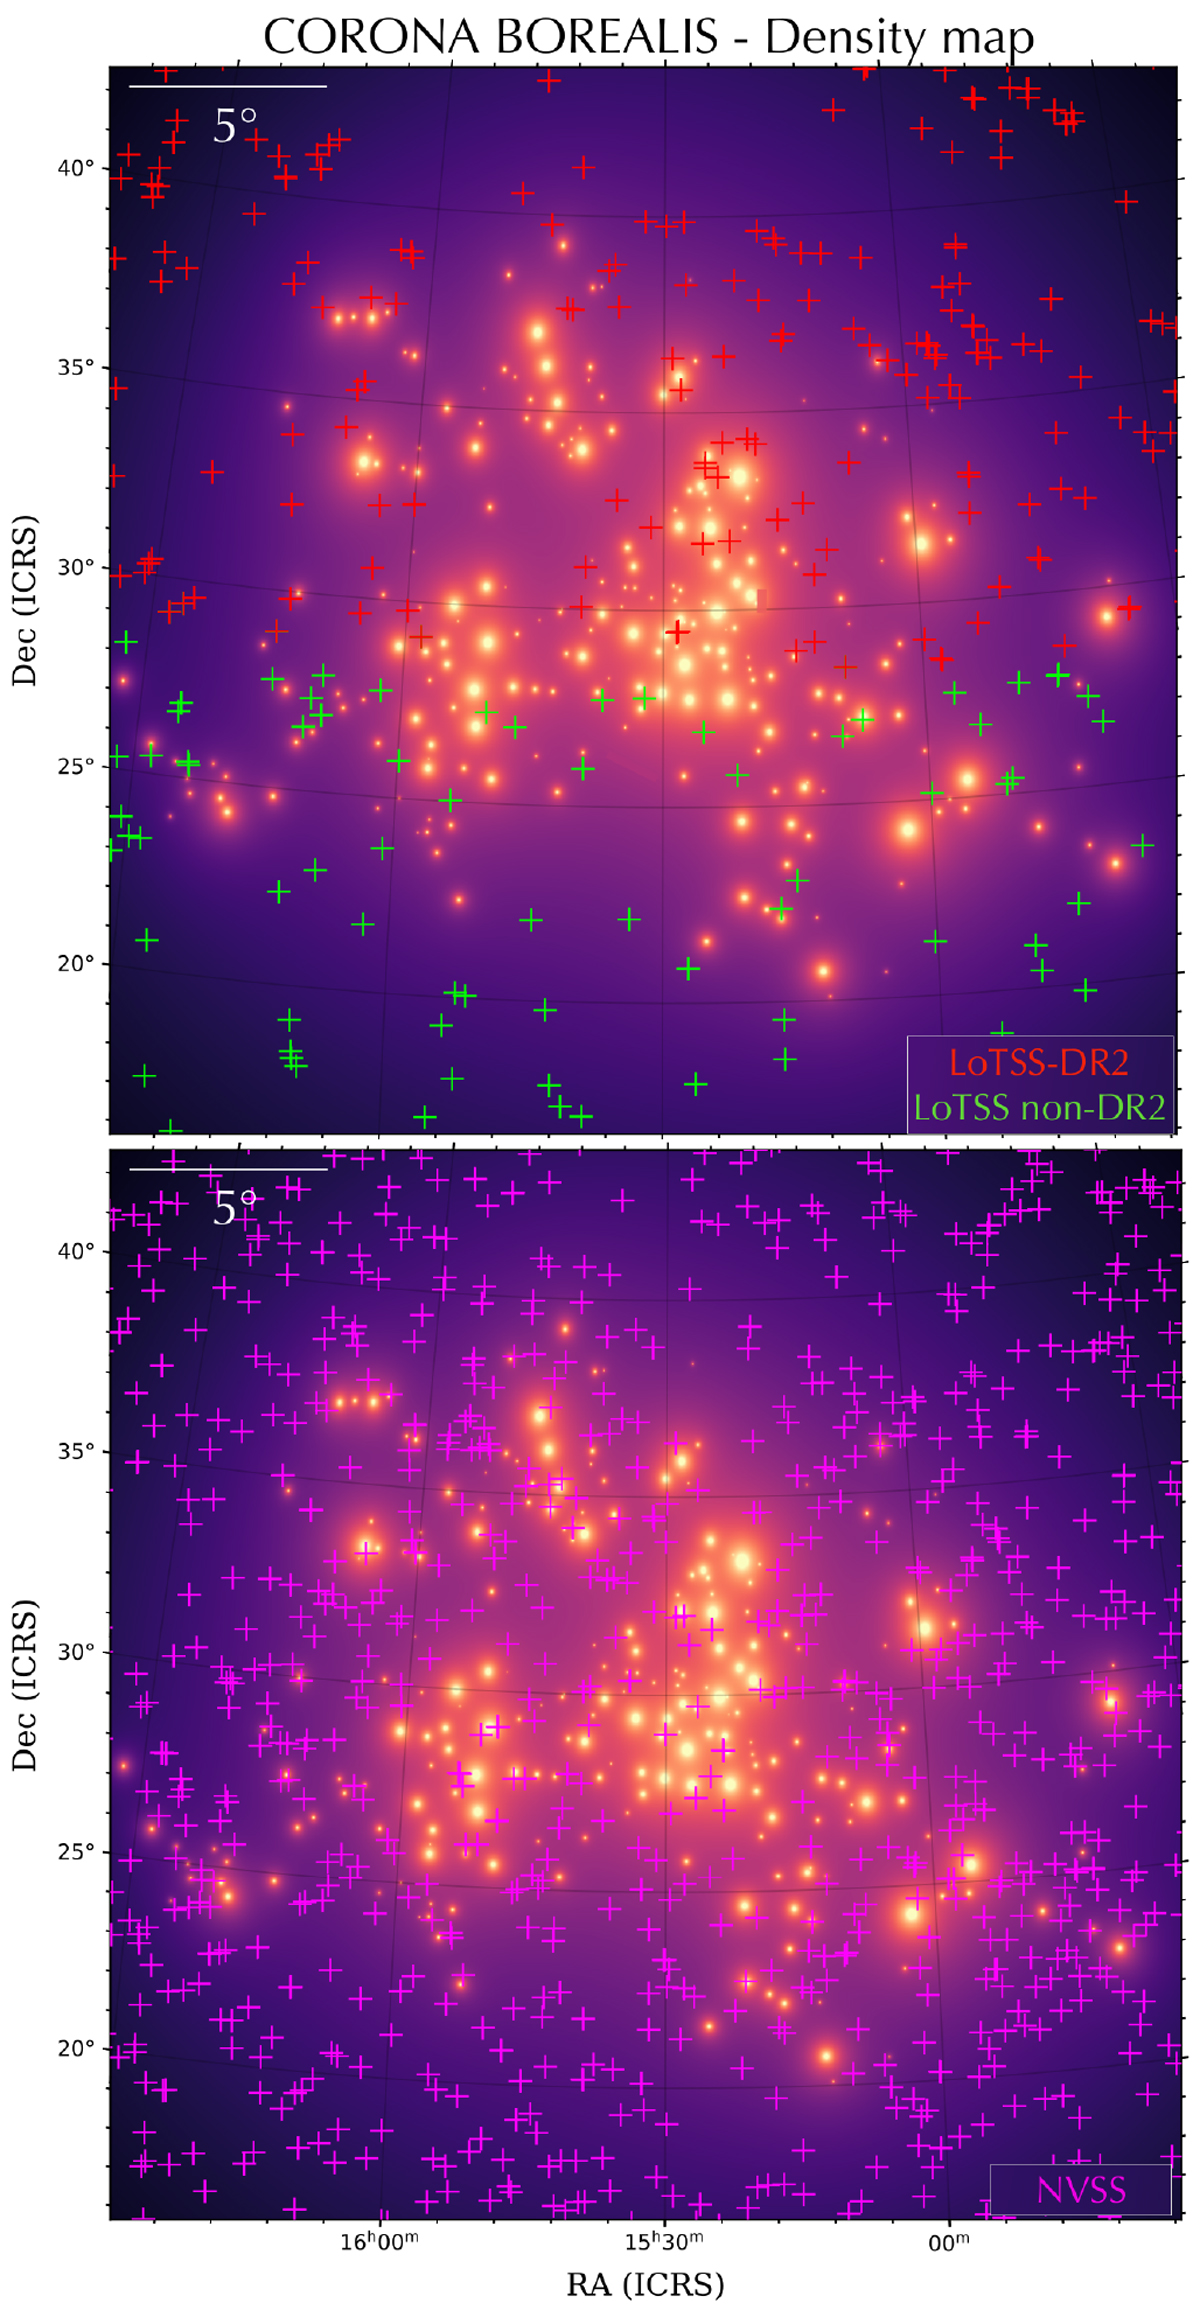
2D density map of the Corona Borealis supercluster, assuming that each member is on the same redshift plane. The location of the RM sources is shown in red for LoTSS-DR2, green for LoTSS non-DR2, and magenta for NVSS.
Current usage metrics show cumulative count of Article Views (full-text article views including HTML views, PDF and ePub downloads, according to the available data) and Abstracts Views on Vision4Press platform.
Data correspond to usage on the plateform after 2015. The current usage metrics is available 48-96 hours after online publication and is updated daily on week days.
Initial download of the metrics may take a while.