Fig. 8
Download original image
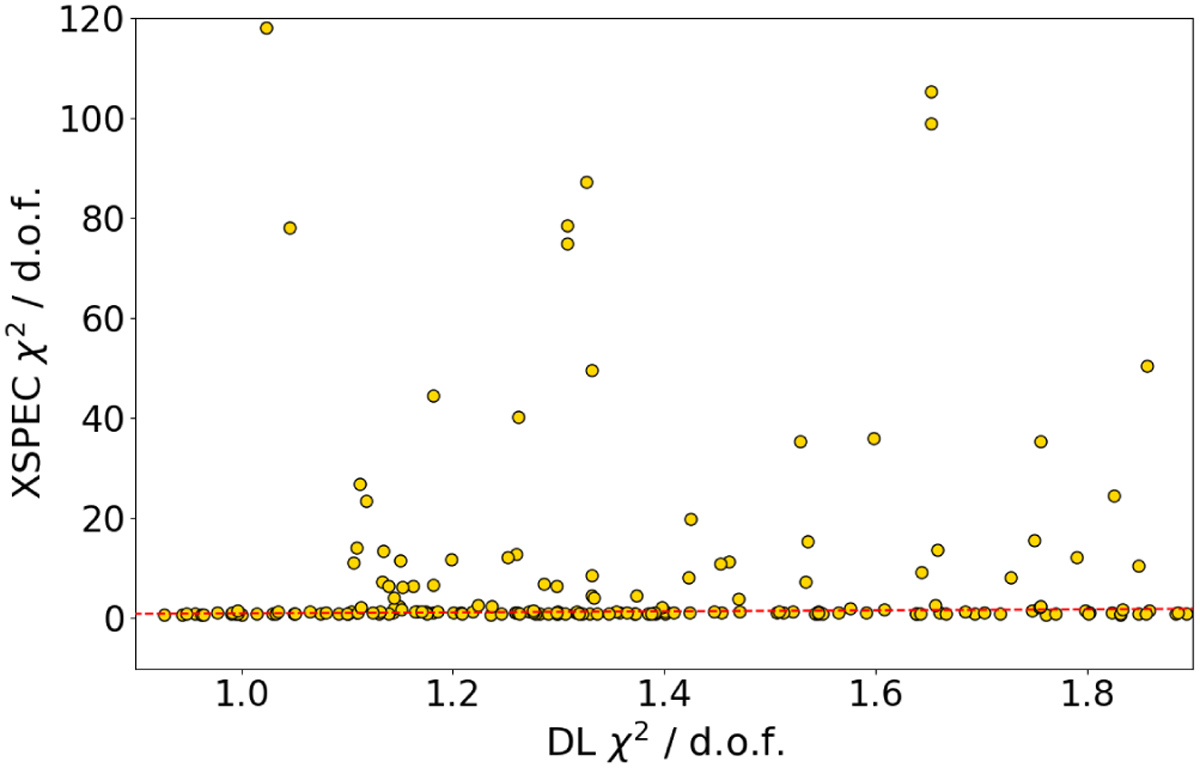
Comparison of XSPEC spectral fitting (χ2 minimization) and predictions from the trained GRU NN for the Model B. The dashed red line represents the expected 1:1 correlation. Points that deviate significantly from this line indicate cases where XSPEC became trapped in a local minimum, highlighting the robustness of the NN approach in avoiding false minima.
Current usage metrics show cumulative count of Article Views (full-text article views including HTML views, PDF and ePub downloads, according to the available data) and Abstracts Views on Vision4Press platform.
Data correspond to usage on the plateform after 2015. The current usage metrics is available 48-96 hours after online publication and is updated daily on week days.
Initial download of the metrics may take a while.