Fig. 5
Download original image
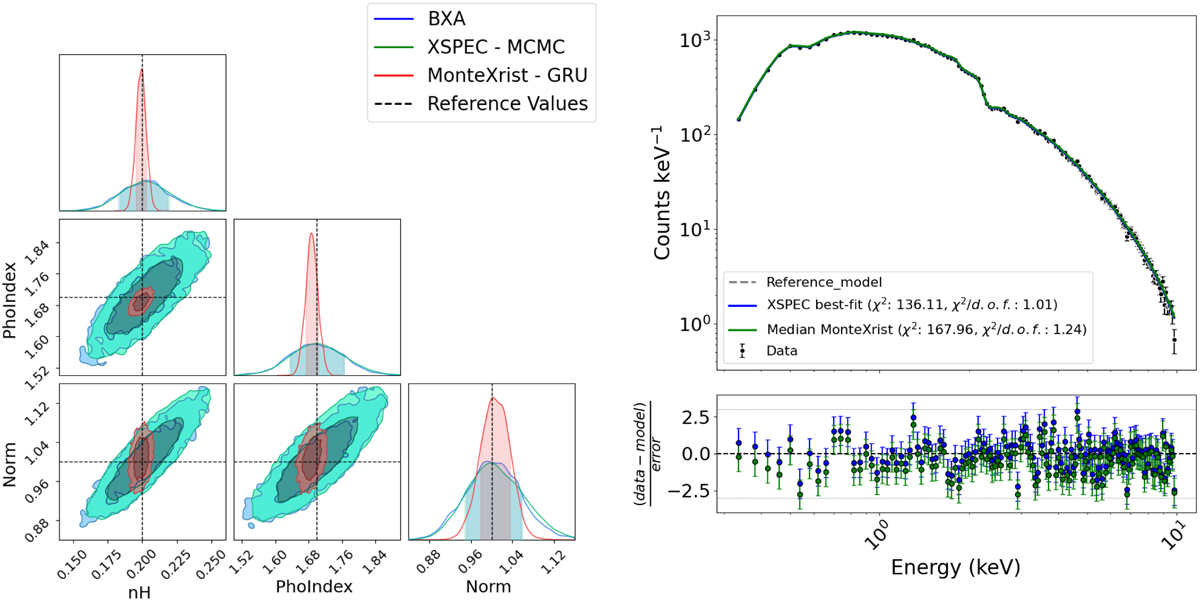
Left: posterior distribution estimated for the reference spectrum with 2000 counts (red). The posterior distributions inferred from Bayesian fits with BXA and XSPEC are also shown in blue and green, respectively. Right: emission spectrum and residuals corresponding to the reference Model A with 2000 counts, together with the folded best-fit model from the GRU (solid green line) and XSPEC (dashed blue line) with a frequentist approach.
Current usage metrics show cumulative count of Article Views (full-text article views including HTML views, PDF and ePub downloads, according to the available data) and Abstracts Views on Vision4Press platform.
Data correspond to usage on the plateform after 2015. The current usage metrics is available 48-96 hours after online publication and is updated daily on week days.
Initial download of the metrics may take a while.