Fig. 3
Download original image
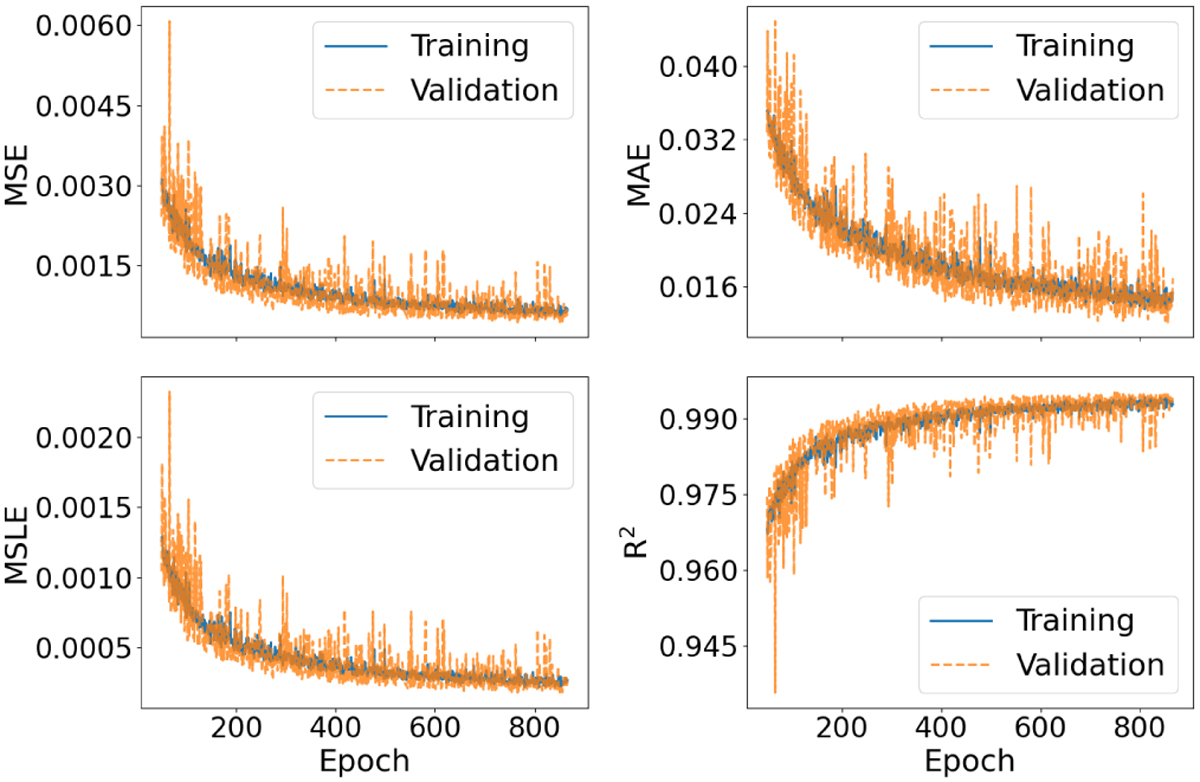
Training history of the NN using the GRU architecture in the case of Model A on Dataset-short. Each plot compares the metric on the training set (solid blue line) with its counterpart on the validation set (solid orange line). The training curve represents the model’s performance on the data it learns from, while the validation curve indicates its performance on a separate dataset (the validation dataset) during the training phase.
Current usage metrics show cumulative count of Article Views (full-text article views including HTML views, PDF and ePub downloads, according to the available data) and Abstracts Views on Vision4Press platform.
Data correspond to usage on the plateform after 2015. The current usage metrics is available 48-96 hours after online publication and is updated daily on week days.
Initial download of the metrics may take a while.