Fig. 1
Download original image
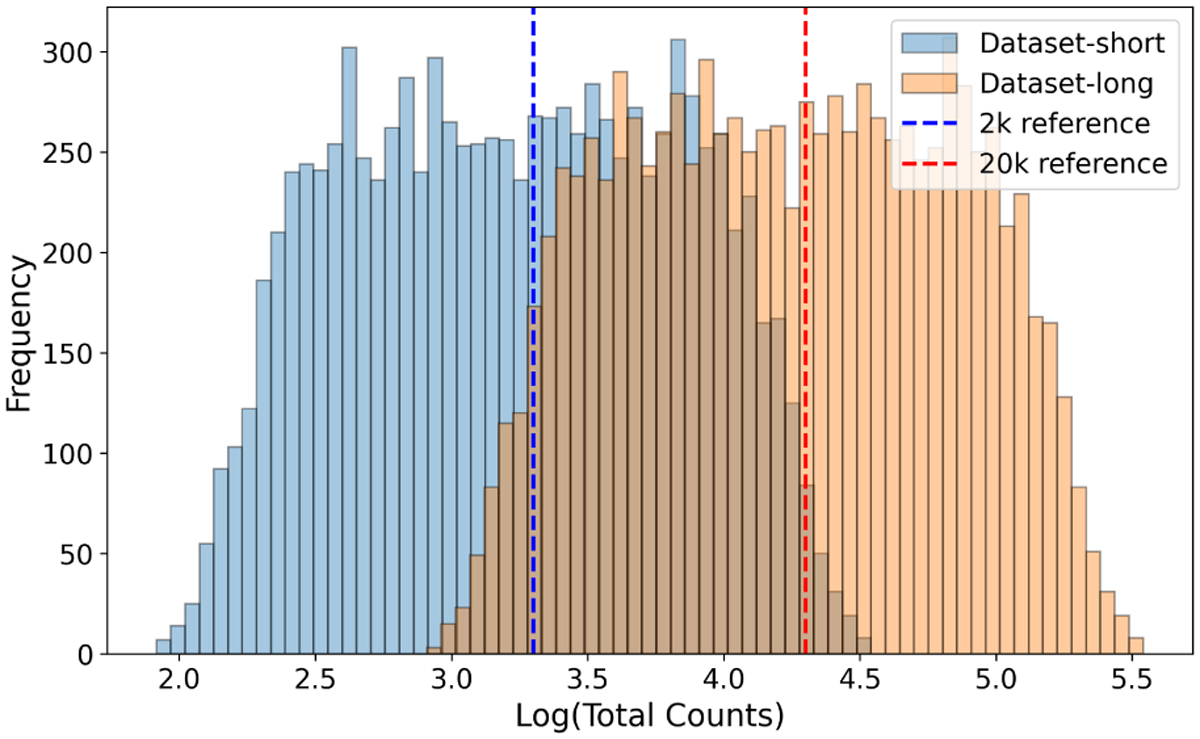
Distribution of total counts for the spectra in the two datasets. The blue histogram represents the dataset based on the reference spectrum with approximately 2 × 10³ total counts (Dataset-short). In comparison, the orange histogram corresponds to the dataset based on the reference spectrum with approximately 2 × 10⁴ total counts (Dataset- long). Both distributions illustrate the variability in total counts due to the range of parameters used in the simulations. Vertical dashed lines show the position of the two reference spectra.
Current usage metrics show cumulative count of Article Views (full-text article views including HTML views, PDF and ePub downloads, according to the available data) and Abstracts Views on Vision4Press platform.
Data correspond to usage on the plateform after 2015. The current usage metrics is available 48-96 hours after online publication and is updated daily on week days.
Initial download of the metrics may take a while.