Fig. E.1.
Download original image
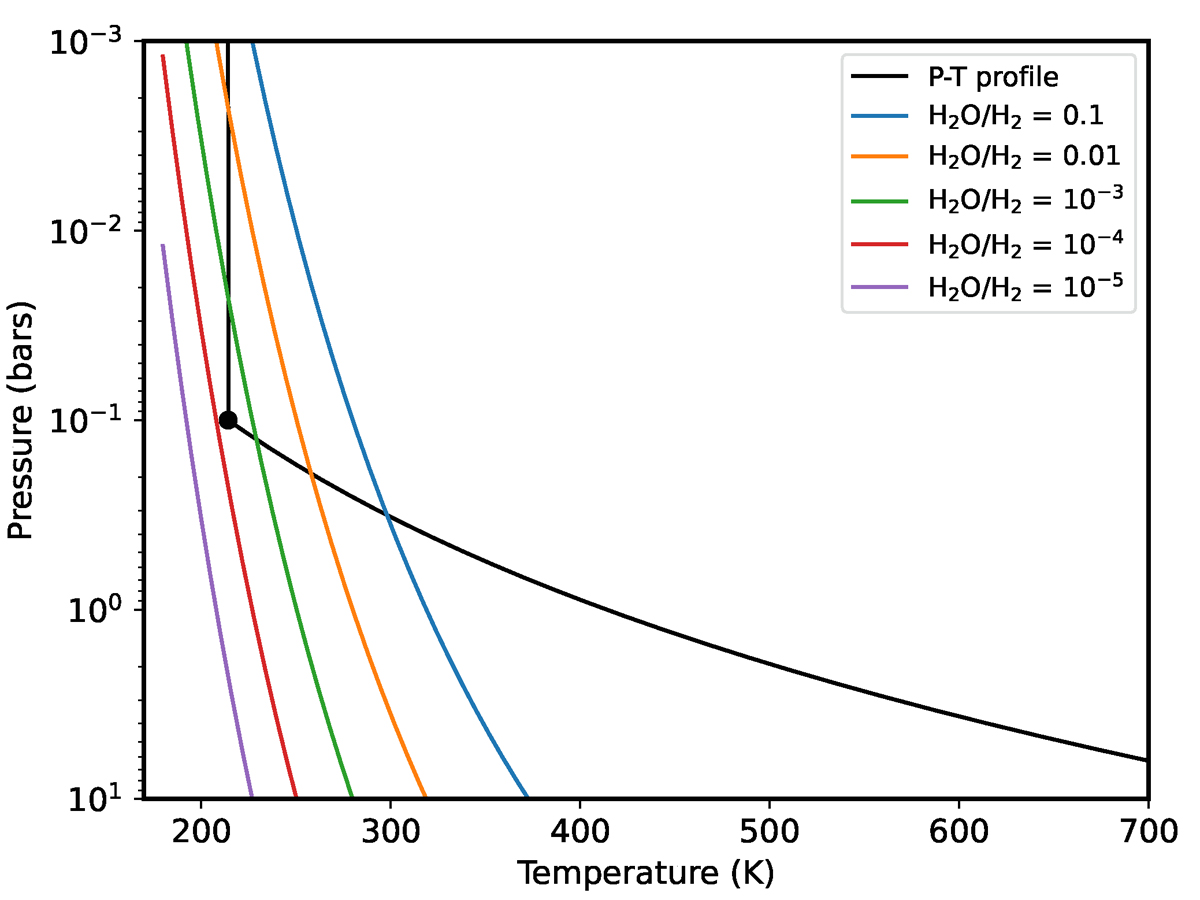
Pressure-temperature profile (black curve) in a simplified H2-rich atmosphere with a radiative-convective boundary at 0.1 bar pressure (black point). The colored lines represent the vapor pressures for different H2O/H2 mixing ratios, and the lowest vapor pressure along the profile occurs at the R-C boundary (black filled circle).
Current usage metrics show cumulative count of Article Views (full-text article views including HTML views, PDF and ePub downloads, according to the available data) and Abstracts Views on Vision4Press platform.
Data correspond to usage on the plateform after 2015. The current usage metrics is available 48-96 hours after online publication and is updated daily on week days.
Initial download of the metrics may take a while.