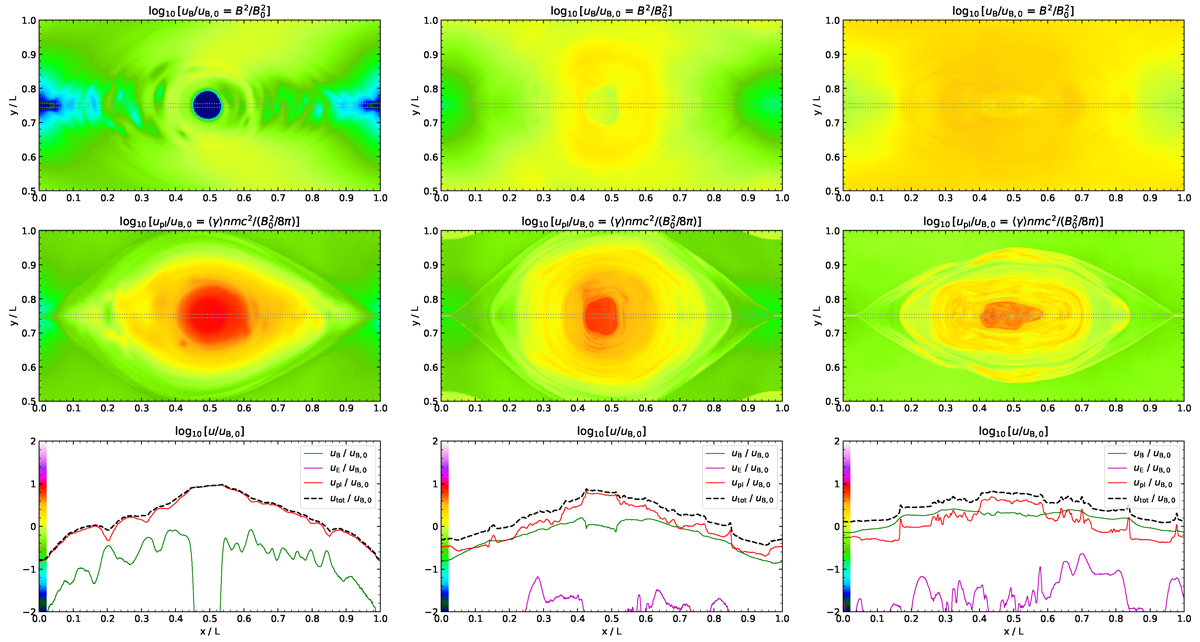
Fig. 2.
Download original image
Maps of log10(u/uB, 0)(x, y) for magnetic energy density, uB = B2/8π (upper panels), and plasma energy density, upl = ⟨γ⟩nmc2 (middle panels), for relaxed monster plasmoids at the end of each simulation. In the lower panels, we compare 1D energy density profiles of (u/uB, 0)(x, y0) measured along the strip indicated in the above maps by the dashed grey lines. A common colour scale for all maps is referenced along the left axes in the lower panels. Here, we present the effect of a guide field for σ0 = 10 and L/ρ0 = 1800. From the left, the columns show simulations: (1) L1800_σ10, (2) L1800_σ10_Bg05, and (3) L1800_σ10_Bg1.
Current usage metrics show cumulative count of Article Views (full-text article views including HTML views, PDF and ePub downloads, according to the available data) and Abstracts Views on Vision4Press platform.
Data correspond to usage on the plateform after 2015. The current usage metrics is available 48-96 hours after online publication and is updated daily on week days.
Initial download of the metrics may take a while.