| Issue |
A&A
Volume 690, October 2024
|
|
|---|---|---|
| Article Number | A389 | |
| Number of page(s) | 10 | |
| Section | Astrophysical processes | |
| DOI | https://doi.org/10.1051/0004-6361/202451229 | |
| Published online | 24 October 2024 | |
Composition-asymmetric and sheared relativistic magnetic reconnection
Univ. Grenoble Alpes, CNRS, IPAG, 38000 Grenoble, France
⋆ Corresponding author; This email address is being protected from spambots. You need JavaScript enabled to view it.
Received:
24
June
2024
Accepted:
18
September
2024
Abstract
Context. Relativistic magnetic reconnection studies have so far focused on symmetric configurations, where the upstream plasma has identical properties on the two sides of the layer. Yet, just like nonrelativistic reconnection on the dayside of the Earth’s magnetosphere, relativistic reconnection can also operate at the interface between highly asymmetric environments. The boundary layer between a relativistic jet and an accretion flow forming around a supermassive black hole can present asymmetric configurations in terms of plasma composition, bulk velocity, temperature, and magnetization.
Aims. We conducted the first study of relativistic magnetic reconnection where the upstream plasma is composed of electron-positron pairs on one side, and electrons and ions on the other. We also investigated the impact of a relativistic symmetric shear flow applied along the reconnecting field lines.
Methods. We simulated magnetic reconnection using 2D particle-in-cell simulations. The initial setup was adapted from a classic Harris layer without a guide field, modified to accommodate plasma-composition and shear asymmetries in the upstream medium.
Results. For a composition-asymmetric setup, we find that the reconnection dynamics is driven by the electron-ion side, which is the plasma with the lowest magnetization. The energy partition favors accelerating ions at the expense of electrons even more than in a corresponding symmetric setup. With respect to shear, a super-Alfvénic upstream decreases the laboratory-frame reconnection rate, but, unlike in nonrelativistic studies, does not shut off reconnection completely.
Conclusions. The asymmetries examined in this work lower the overall efficiency of electron acceleration relative to corresponding symmetric configurations. In the context of a black hole jet-disk boundary, asymmetric reconnection alone is probably not efficient at accelerating electrons to very high energies, but it might facilitate plasma mixing and particle injection for other acceleration channels at the interface.
Key words: acceleration of particles / magnetic reconnection / plasmas / methods: numerical
© The Authors 2024
 Open Access article, published by EDP Sciences, under the terms of the Creative Commons Attribution License (https://creativecommons.org/licenses/by/4.0), which permits unrestricted use, distribution, and reproduction in any medium, provided the original work is properly cited.
This article is published in open access under the Subscribe to Open model. This email address is being protected from spambots. You need JavaScript enabled to view it. to support open access publication.
1. Introduction
Magnetic reconnection is a widely studied plasma phenomenon, heating and accelerating particles through a change in the global magnetic topology (Zweibel & Yamada 2009). This process typically occurs when two antiparallel magnetic field lines snap and recombine across a thin current layer. The relativistic regime of reconnection has garnered wider interest in the last decade, as it provides efficient nonthermal particle acceleration (e.g., Hoshino et al. 2001; Hoshino & Lyubarsky 2012; Cerutti et al. 2012a; Sironi & Spitkovsky 2014; Guo et al. 2014; Kagan et al. 2015; Werner et al. 2016). Here, in contrast to nonrelativistic reconnection, the energy associated with the magnetic field dominates over the plasma rest mass energy, providing a significant free-energy reservoir for particle energization. Several regimes of relativistic magnetic reconnection have now been studied, including reconnection with different plasma compositions (i.e., electron-positron pairs and electron-ion plasmas; Melzani et al. 2014; Werner et al. 2018), reconnection involving strong radiative cooling and pair production (Jaroschek & Hoshino 2009; Cerutti et al. 2013; Hakobyan et al. 2019; Schoeffler et al. 2019; Mehlhaff et al. 2024), and reconnection driven by other plasma processes, such as turbulence (Zhdankin et al. 2017; Comisso & Sironi 2018; Meringolo et al. 2023) and Kelvin-Helmholtz or Rayleigh-Taylor instabilities (Cerutti & Giacinti 2020; Sironi et al. 2021; Zhdankin et al. 2023).
Relativistic magnetic reconnection is a key driver of high-energy emission in various astrophysical environments. In pulsar magnetospheres, the equatorial current sheet forming beyond the light cylinder undergoes reconnection in a strongly radiative and pair-producing regime, emitting gamma-ray emission through synchrotron radiation (Lyubarskii 1996; Uzdensky & Spitkovsky 2014; Cerutti et al. 2016). Similar processes may also power gamma-ray flares in the Crab nebula (Uzdensky et al. 2011; Cerutti et al. 2012b), magnetar eruptions and fast radio bursts (Lyutikov 2003; Yuan et al. 2020; Mahlmann et al. 2022). In active galactic nuclei, magnetic reconnection may explain gamma-ray flares within blazar jets (Giannios et al. 2009; Nalewajko et al. 2011; Petropoulou et al. 2016; Mehlhaff et al. 2020) and bursting activity closer to the central supermassive black hole, for instance X-ray flares in Sgr A* (Ball et al. 2016; Scepi et al. 2022) and gamma-ray flares in M 87* (Crinquand et al. 2021; Ripperda et al. 2022; Hakobyan et al. 2023; Stathopoulos et al. 2024).
Recent very long baseline interferometry observations of M 87* show a clear edge-brightened jet connected to the innermost parts of the accretion flow (Lu et al. 2023), suggesting that particles are accelerated at the interface between these two entities. In the framework of a Poynting-flux-dominated jet (Blandford & Znajek 1977), this boundary layer may separate a relativistic ultra-magnetized jet loaded with pairs produced near the ergosphere on one side from a hot mildly magnetized accretion flow composed of electrons and ions on the other side. Such abrupt discontinuities in plasma composition, temperature, bulk velocity, and magnetization may lead to a qualitatively different particle acceleration compared to a symmetric environment.
Recent global modeling efforts suggest that magnetic reconnection is a prominent particle acceleration mechanism at such highly asymmetric jet-disk boundaries. The accretion of magnetic loops onto a spinning black hole leads to the formation of reconnecting current sheets between the jet and the disk (Parfrey et al. 2015; Yuan et al. 2019; El Mellah et al. 2022, 2023). Magnetic flux eruptions in general relativistic magnetohydrodynamic (GRMHD) simulations also provoke large-scale reconnection events that push magnetized flux tubes through the accretion flow (e.g., see Igumenshchev 2008; Tchekhovskoy et al. 2011). This phenomenon can be accompanied by additional current sheet formation at the interface between the jet and the disk (Ripperda et al. 2020, 2022; Chashkina et al. 2021; Vos et al. 2024). However, it is unclear how magnetic reconnection and particle acceleration proceed within such asymmetric boundary layers.
Asymmetric and sheared magnetic reconnection have previously been studied in the nonrelativistic regime, in particular in the context of the interaction between the Earth’s magnetosphere and the solar wind (i.e., the magnetopause). An important takeaway message from these studies is that a strong velocity shear applied along the field lines decreases the reconnection rate. It can even halt the process entirely for super-Alfvénic flows (La Belle-Hamer et al. 1995; Cassak & Otto 2011; Cassak 2011). An asymmetry in the upstream plasma density and magnetic field strength leads to a global reorganization of the current layer and a change in the plasmoids’ shape (Murphy et al. 2012; Eastwood et al. 2013). However, from these studies alone it is unclear how such asymmetries would affect particle acceleration in a relativistic context.
The first study of relativistic asymmetric magnetic reconnection was recently carried out by Mbarek et al. (2022). They simulated a pair plasma with an upstream density and different magnetic field strengths on the two sides of the reconnection layer, hence creating a magnetization asymmetry in the reconnection process. They find that the less magnetized side dictates the reconnection rate, and that particle acceleration remains in an intermediate regime between the higher and lower magnetizations. This result suggests that particle acceleration via reconnection could be quenched at a black hole jet-disk interface.
In this study, our first objective is to investigate the role plasma asymmetries play in particle acceleration and mixing within relativistic reconnection layers, using 2D particle-in-cell (PIC) simulations. More specifically, and in contrast to Mbarek et al. (2022), we investigated the role of a plasma-composition asymmetry where one side is filled with an ultra-relativistic ultra-magnetized plasma of pairs, while the other side is composed of a mildly relativistic and magnetized electron-ion plasma. This configuration is reminiscent of a black hole jet-disk boundary layer. Our second objective is to evaluate the impact of a relativistic shear flow directed along the field lines – another property reminiscent of the jet-disk boundary – on the reconnection rate and on the particle acceleration efficiency.
This article is organized as follows. In Section 2, we detail the modifications made to the classic relativistic Harris setup to implement a velocity shear and a composition asymmetry in the upstream medium. In Sections 3 and 4, we respectively present our findings on composition asymmetry and shear. We summarize and discuss the implications of our results in Section 5.
2. Numerical setup
2.1. Asymmetric Harris equilibrium
In this work, we employed Zeltron, an electromagnetic PIC code developed by Cerutti et al. (2013), Cerutti & Werner (2019). Our aim was to simulate a current layer that would have been locally formed by instabilities on a global jet-disk interface using a 2D local Cartesian box. In our simulations, the initial plasma was composed of pairs above the reconnection layer, representing the “jet side”, while the plasma below was composed of electrons and ions, representing the “disk side”. As shown by GRMHD simulations (e.g., Vos et al. 2024), the magnetic field strength is expected to be similar on each side of the interface. The magnetization contrast should then be only imposed by the composition and/or density asymmetry. We therefore imposed the same initial magnetic field strength on both sides of the reconnection layer. This is another difference (in addition to the plasma composition and shear) from the setup used by Mbarek et al. (2022).
Our boundary conditions are reflective on the upper and lower sides of the box and periodic on the right and left sides. These conditions apply for both the fields and the particles. For the initial conditions, we adapted the classic relativistic Harris setup with no guide (out-of-plane) field component, which involves an initial antiparallel magnetic field supported by an equatorial current layer (e.g., Kirk & Skjæraasen 2003). This initial current sheet is razor thin (on the plasma skin depth scale, defined below), perhaps much thinner than in a real jet-disk interface. This merely helps kick-start reconnection, allowing us to study the nonlinear evolution of the current sheet in its more developed and effectively thicker stage.
The initial Harris magnetic field profile is given by
 (1)
(1)
where δ is the initial current layer thickness, Ly (Lx) is the height (width) of the box, and ex is the unit vector along the x-direction. This magnetic field is supported by a layer of positively and negatively charged particles counterstreaming, or drifting, in the out-of-plane (i.e., z) direction. Their bulk drift velocity is set to VH/c = 0.6, giving the current density,
 (2)
(2)
where e is the positron charge. The drifting particle number density reads
 (3)
(3)
where nH, 0 = cB0/8πeVHδ. In symmetric reconnection studies, the box is filled with a uniform background plasma. However, in our scenario, the characteristics of the background plasma vary depending on the vertical position in the box. In the upper half of the box (y > Ly/2, i.e., the jet side), the background plasma is composed exclusively of pairs of total mass density 2menj, while in the bottom half (y < Ly/2, i.e., the disk side), it is composed of electrons and ions of total mass density (me + mi)nd = (1 + μ)mend, where μ = mi/me is the ion-to-electron mass ratio. On the jet (disk) side, the plasma moves along field lines with bulk velocity Vs = Vsex (−Vsex) with a corresponding Lorentz factor Γs = (1 − Vs2/c2)−1/2: a symmetric shear with an abrupt transition at the midplane.
In order for the simulation to start in equilibrium, we needed to ensure pressure balance both between the current sheet and the upstream magnetic field, and between the jet and the disk. This requires
 (4)
(4)
 (5)
(5)
where Tj and Td represent the respective initial temperatures of the jet and disk plasmas in the laboratory frame, kB is the Boltzmann constant and  is the drifting particles’ comoving temperature (considering a Lorentz factor ΓH = (1 − VH2/c2)−1/2). We note that the plasma-β parameter, defined as β = 16πnkBT/B02, has an identical value for both the jet and disk sides (see Mbarek et al. (2022) for a β asymmetric setup), but the magnetization in the laboratory frame, defined as σj = B02/8πΓsnjmec2 for the jet and σd = B02/4πΓsnd(me + mi)c2 for the disk, changes because of the composition contrast. A global sketch of the initial setup is provided in Fig. 1.
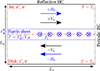 |
Fig. 1. Sketch of the simulation setup. The dashed red line separates the pair plasma on the jet side (upper half) from the electron-ion plasma on the disk side (bottom half). Shear flow is parallel to the magnetic field on each side. “BC” stands for “boundary conditions”. |
We needed the initial particle energy distribution functions in order to impose the previously defined macroscopic quantities. They follow relativistic drifting Maxwellians as defined by Swisdak (2013). Therefore, we had to initialize two distribution functions for the current layer (pairs and ions), two for the disk side (electrons and ions), and one for the jet side (pairs). We defined four species of particles: the positrons (in the jet region), the ions (of charge +e in the disk region), and the electrons in each region. Their respective density profiles  are
are
where H is the Heaviside step function, and the parameter f represents the mixing fraction in the Harris sheet. For f = 0 (f = 1), the initial current layer is exclusively composed of disk (jet) plasma. This parameter only sets the initial state of our setup, and we verified that it does not affect the simulation behavior. Thus, we set its value to f = 1/2. When defining the particles’ momenta, we needed to decide whether we considered them to be part of the Harris sheet, in which case we assigned them a drift velocity ±VHez, or in the disk/jet, in which case we assigned them a shear bulk motion ±Vsex. For a particle at a given coordinate y, the following number is computed:
 (6)
(6)
Subsequently, a random number between 0 and 1 is drawn. If it exceeds P(y), then the particle is considered to follow the Harris layer energy distribution function; otherwise, it will have a background energy distribution function. It can be easily verified that, far from the current sheet, P(y)→1 so that the particle will almost always follow a background distribution. Conversely, in the current sheet it will likely follow a Harris distribution.
Following Werner et al. (2018), a small (one percent) tearing-like perturbation is applied to the initial magnetic field (Eq. 1). This procedure serves two purposes: (i) it speeds up the onset of reconnection, and (ii) it predefines the location of the main X and O points during the active phase of the simulation and facilitates the measurement of the reconnection rate as shown in Sect. 2.3 hereafter. With this perturbation, the initial out-of-plane component of the magnetic vector potential reads
![Mathematical equation: $$ \begin{aligned} A_z =&B_0 \delta \left\{ \ln \left[\cosh \left(\frac{{ y}-L_{ y}/2}{\delta }\right)\right] - \ln \left[\cosh \left(\frac{L_{ y}}{2\delta }\right)\right]\right\} \nonumber \\&\times \left\{ 1 + 0.01 \cos \left(2\pi \frac{x-3 L_x/4}{L_x}\right) \cos ^2 \left(\pi \frac{{ y}-L_{ y}/2}{L_{ y}}\right)\right\} \cdot \end{aligned} $$](/articles/aa/full_html/2024/10/aa51229-24/aa51229-24-eq10.gif) (7)
(7)
The dimensions of the cells in each direction, Δx and Δy, are set to be equal and the time step, Δt, is set at 0.99 times the critical Courant-Friedrichs-Lewy time step. We initialized the simulations with 16 particles per species per cell.
In summary, the setup allows for the manipulation of several free parameters, including plasma β, the disk magnetization σd, the jet-disk density ratio nj/nd, and the shear flow velocity Vs. For the remainder of this study, we set nj = nd for numerical convenience, thus only imposing a magnetization asymmetry through the mass ratio between pairs and ions. This assumption may not be very realistic in the context of a jet-disk boundary layer where a strong number density contrast is expected, but it still captures a mass density contrast, 2njme ≪ nd(mi + me).
2.2. Sets of simulations
Given our setup, this work consists of two series of simulations. In the first, we studied the effect of composition asymmetry on magnetic reconnection without velocity shear (i.e., setting Vs = 0). This asymmetry leads to a magnetization contrast since, for μ ≫ 1, the jet magnetization is σj ≃ μσd/2. We set μ = 100 so that the magnetization ratio is σj/σd ≃ 50, and we explored the parameter space (β, σd) in the nine simulations listed in Table 1. We adopted plasma conditions previously studied by Ball et al. (2018) and similar to those observed at jet-disk interfaces in GRMHD simulations, where the ion magnetization is trans-relativistic (σd ≲ 1) while that for pairs is ultra-relativistic (σj ≫ 1). In addition to our nine asymmetric simulations, we present two symmetric electron-ion simulations for comparison where the jet’s plasma has the same properties as the disk’s. The resolution is fixed in terms of the nominal electron Larmor radius ρ0 = mec2/eB0 = 8Δx/3. Thus, the skin-depth ranges from de = c/ωpe ∼ 8Δx to de ∼ 27Δx, where  is the electron plasma frequency. The initial current sheet width is set to δ ≃ 5Δx.
Full list of simulations performed in this study.
The second set of simulations focuses on the effect of a velocity shear along the reconnection layer with a symmetric pair plasma (μ = 1). Here, we fixed β = 5 × 10⁻² and the magnetization, σd, was set to either 1 or 10. For both values of σd, we scanned the dimensionless shear four-velocity, Us = ΓsVs/c, from 0 to 2UA, where  is the relativistic Alfvén four-velocity. The resolution was set such that Γsρ0 = 16Δx for σd = 1, and Γsρ0 = 2Δx for σd = 10. This ensures that the hot skin depth
  is conserved for all simulations sharing the same σd value: de, h ∼ 6Δx (σd = 10), de, h ∼ 16Δx (σd = 1). The current sheet width was set to δ = 4Δx. A summary of the simulation parameters is provided in Table 1.
2.3. Measurement of the reconnection rate
We measured the reconnection rate based on the evolution of the reconnected magnetic flux, denoted as Φrec, and defined by the equation,
 (8)
(8)
Here, “X” represents the location of the major X point, which corresponds to the maximum of Az in the midplane. On the other hand, “O” denotes the location of the major O point at the center of the largest plasmoid; it coincides with the minimum of Az in the midplane. Using Faraday’s law, the instantaneous dimensionless reconnection rate, denoted as βrec, can then be expressed as,
 (9)
(9)
Following the methodology outlined by Werner et al. (2018), we calculated a mean reconnection rate, denoted as ⟨βrec⟩, by averaging the previously defined instantaneous rate over the time interval between t20% and t40%. Here, t20% and t40% correspond to the instants when 20% and 40% of the initial magnetic flux in half of the box, Φ0 = B0Ly/2, has reconnected. By measuring in this time interval, we aimed to isolate the intrinsic reconnection rate, avoiding artificial contributions from both the initial phase, when reconnection is still ramping up, and from the late-time phase, when reconnection starts to slow down due to the finite flux available in the box. Because of the intermittent nature of magnetic reconnection, there is a scatter of about 10% to 15% in our measurements of the reconnection rate.
3. Composition asymmetry results
3.1. Kinematics and global behavior
We show two representative snapshots of the plasma density and field lines from our composition-asymmetric runs in Fig. 2. At first glance, there are no noticeable differences with previous symmetric studies: the current sheet becomes quickly unstable to the tearing mode, creating a chain of merging plasmoids separated by X points. However, a closer look at the system – and in particular its time evolution – reveals that fast magnetosonic waves launched during plasmoid mergers propagate faster and on shorter length scales on the pair side than on the electron-ion side, an effect resulting from the higher σ of the pair plasma. This wave-speed asymmetry leads to differing plasma response times on each side, which provokes an oscillatory vertical motion of the current layer that is absent in symmetric simulations (see the full time evolution of the simulation in the animation provided online).
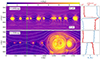 |
Fig. 2. Plasma number density in the composition asymmetric setup (no shear) shown in the middle of the reconnection process (top left panel; Φrec ∼ 0.15Φ0) and toward the saturation stage (bottom left panel; Φrec ∼ 0.45Φ0) for σd = 0.1, β = 10−3, and σj = 5 (run SD01B0001). White contours represent magnetic field lines. We provide in the top and bottom right panels a plot of different quantities for the slice shown by the dashed green line on the density maps. The blue curve represents the x component of the magnetic field, and the red curve represents the plasma mass density, ρ (in logarithmic scale). The box midplane is represented by the dashed black lines. For the time evolution, see the online animation. |
As opposed to previous studies of both relativistic and nonrelativistic asymmetric magnetic reconnection (Murphy et al. 2012; Mbarek et al. 2022), the shape of the plasmoids seems rather symmetric. This behavior can be explained by the fact that the magnetic field strength is symmetric in our setup. The magnetic pressure is thus the same on both sides of the reconnection layer, resulting in the absence of strong plasmoid deformation.
We measure reconnection rates in our asymmetric configurations that are slightly higher (∼30% more) than in our corresponding symmetric electron-ion plasma simulations. For instance, we obtain ⟨βrec⟩≃0.029 for the asymmetric run with σd = 0.1 and β = 10−3 while the corresponding symmetric simulation showed ⟨βrec⟩≃0.022 (see Table 1). Even so, the rate stays much smaller than what would be expected for symmetric pair-plasma reconnection (i.e., βrec ∼ 0.1). This suggests that the side with the lowest magnetization primarily dictates the overall reconnection rate, as previously demonstrated in the context of density and magnetic field asymmetries by Mbarek et al. (2022).
3.2. Energy partition and mixing
We investigated the particle and energy mixing between the disk and the jet shown in the left panels of Fig. 3. The density mixing between the jet and the disk is very efficient at the X points and in the plasmoids. This behavior may explain the previously observed dynamics of the reconnection process: because reconnection efficiently mixes particles, the magnetization in the reconnection layer is locally the one imposed by the disk ions, since, after mixing, these particles control the local mass density. Looking at the energy mixing in Fig. 3 (right panels), we observe that the energy density of the disk significantly prevails within the plasmoids. This dominance of the disk energy, coupled with the homogeneous mixing of particles, implies that the disk undergoes more substantial energization compared to the jet plasma during the reconnection process. Additionally, we remark that a few highly energetic protons manage to get to the upper edge of plasmoids. We speculate that, in 3D, where plasmoids have been shown to be less efficient at confining high-energy particles (Zhang et al. 2021; Chernoglazov et al. 2023), this tendency would allow particles to escape plasmoids even more effectively and contaminate the jet.
We plot the ratio of the jet-to-disk particles’ total kinetic energies in Fig. 4 for our entire composition-asymmetric simulation campaign. The total kinetic energies for disk and jet particles are defined as
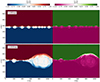 |
Fig. 3. Plasma number density mixing (left panels) defined as (nj − nd)/(nd + nj), and plasma kinetic energy density mixing (right panels) defined as (ϵj − ϵd)/(ϵd + ϵj), where ϵj/d = γnj/dmc2, in the early (top panels; Φrec ∼ 0.15Φ0) and late (bottom panels; Φrec ∼ 0.5Φ0) stages of the simulation. Here, σd = 0.3 and β = 10−2 (run SD03B001). |
 (10)
(10)
 (11)
(11)
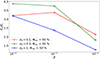 |
Fig. 4. Energy partition between the electron-ion (disk) plasma and the pair (jet) plasma at the stage when half of the initial magnetic flux has reconnected, Φrec = 0.5Φ0. |
In order to compare simulations with different reconnection rates – and thus varying time evolution – we computed this ratio once 50% of the initial magnetic flux had reconnected (the results are unchanged if we consider the instants when 30% and 40% of the initial flux is reconnected). The first conclusion is that in every case, the disk retrieves more energy than the jet from the reconnection event: up to four times more for the lowest plasma-β simulations, β = 10−3. Second, higher magnetization (σd = 1) means a more symmetric behavior between the pairs and ions, and thus explains why the energy ratio decreases when σd = 1. With a higher value of β, the plasma’s initial thermal energy is more significant compared with the magnetic energy. Hence the energization during magnetic reconnection is less significant and the energy ratio is thus less affected. However, the fact that σi = 0.3 seems to create slightly more asymmetry than σi = 0.1 at low-β remains unexplained.
We emphasize the fact that most of the asymmetry in Ed/Ej is due to the ions acquiring much more energy from the reconnection process, as previously observed by Werner et al. (2018), Ball et al. (2018) in electron-ion reconnection studies. Despite this qualitative similarity with the symmetric case, the preferential energization of ions over electrons is quantitatively more extreme in the presence of asymmetry with respect to findings of earlier symmetric electron-ion reconnection work. We measure, for instance, in our σ = 0.1 and β = 10−3 simulation, that the ion kinetic energy ends up ∼5.6 times higher than that of the disk electrons (i.e., a higher ratio than Ed/Ej in Fig. 4 because here we compare the disk ions to only the disk electrons). In contrast, for our corresponding symmetric simulation, we measure this ratio as 3.4, consistent with Werner et al. (2018). This extra preferential ion energization tends to vanish for higher magnetizations.
3.3. Spectra
We further investigated the asymmetry in plasma energy gain during the reconnection process by looking at the particle energy distributions (Fig. 5). Looking first at the σi = 0.1, β = 10−3 run, we notice that the ions reach higher energies than the leptons (∼3 times more). Given that the magnetization is less than one, a distinct nonthermal tail is not apparent. These two observations are in accord with earlier symmetric studies (Melzani et al. 2014; Werner et al. 2018; Ball et al. 2018). Instead of a non thermal tail, the particle spectra are composed of two nearly thermal humps: a low-energy hump representing the initial thermal distribution, and a high-energy component corresponding to the plasma energized by reconnection. The gap of a factor of ∼10 between the high-energy electron and ion peaks is consistent with the lower efficiency for the lepton heating observed in Sect. 3.2. If the leptons were instead heated as much as the ions, both species should reach a final energy of (⟨γ⟩−1)m/me ∼ σimi/me ∼ 10. However, this is only consistent with the energy of the ion peak (∼10); the lower electron peak (∼1) can only be explained by a reduced lepton heating efficiency with respect to ions. Examining next the σd = 1 regime, nonthermal tails with slightly differing slopes start appearing for the leptons. The cutoff energy seems to be similar for all species (electrons and ions); however, the fraction of ions reaching higher energies is significantly higher.
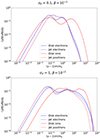 |
Fig. 5. Particle energy distributions for all species at the end of the σd = 0.1 (SD01B0001; top panel) and σd = 1 (SD1B0001; bottom panel) runs, for β = 10−3. |
We compare the asymmetric and symmetric runs with σd = 0.1 and β = 10−3 in Fig. 6. Both runs show similar spectral shapes, but the asymmetric particle distribution appears shifted to slightly higher energies. One reason for this shift could be that there are two times more ions for the same amount of magnetic energy in the symmetric simulation compared to the asymmetric run. Overall, despite subtle differences, the asymmetric and corresponding symmetric runs both show a strong bias, as the magnetization decreases, toward ion acceleration at the expense of electrons. The key insight from this analysis is then that it is this bias – which is evidently independent of the composition asymmetry – that primarily explains the large energization discrepancy between the jet and disk plasmas.
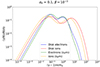 |
Fig. 6. Same as the top panel in Fig. 5 but with identical plasma properties on the two sides (i.e., symmetric reconnection with σj = σd = 0.1 and β = 10−3, run S01B0001SYM). |
4. Sheared reconnection results
4.1. Overall picture
In our second set of simulations, we returned to a a symmetric pair-plasma composition. Here, the current layer is anti-symmetrically sheared by the upstream pair plasma, which moves with a bulk velocity ±Vsex. Given that certain simulations involve elevated bulk Lorentz factors (Γs ≳ 5), we applied a nine-point digital filter to the current densities at each timestep (Langdon & Birdsall 1970) to avoid the numerical Cherenkov effect.
We show a plasma density plot for the case of super-Alfvénic shear (Us = 2UA) in Fig. 7. The propagation of fast magnetosonic waves is affected by the shear: the wave fronts are inclined with respect to the reconnection layer instead of, as occurs when Vs = 0, nearly parallel to it. Despite the strong bulk motion, X points and plasmoids are not swept away because the shear is symmetric.
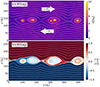 |
Fig. 7. Simulation of pair-plasma relativistic magnetic reconnection with an antisymmetric shear applied along the current layer. Top: Plasma number density. Bottom: Mixing of both upstream plasmas as in Fig. 3. Here, σd = 1, Us = 2UA (run SD1US6), and the white contours represent the magnetic field lines. For the time evolution, see the online animation. |
Spiral patterns clearly appear in the density mixing map, as shown on the bottom panel of Fig. 7 (e.g., in the rightmost plasmoid with center located near x = 500de). In the context of shear, plasma flows into plasmoids from X points with a preferential velocity direction set by whether the X point flanks the plasmoid to the right or to the left. Plasma entering from an X point to the right (left) of a given plasmoid comes preferentially from the leftward-moving (rightward-moving) upstream plasma below (above) the layer. This plasma then follows a freshly reconnected magnetic field line, tracing a spiral trajectory around the core of the growing plasmoid. A plasmoid trapped between two active X points is thus fed by the upper plasma from its left side and by the lower plasma from its right side, producing, respectively, the red and blue spirals in Fig. 7. Other than such spiral features in the density mixing map, reconnection proceeds in a similar fashion as for an initially static upstream plasma.
According to the linear analysis performed by Chow et al. (2023), we can expect the appearance of the Kelvin-Helmholtz (KH) instability for simulations where Vs > VA. However, the tearing instability seems to grow more rapidly than the KH instability, and there is no clear sign of KH vortex formation throughout the duration of the simulations. As plasmoids grow during the evolution of the system, the velocity gradient across the midplane decreases, further inhibiting the operation of the KH instability. A sharp velocity gradient is maintained only in the vicinity of X points. Toward the end of the simulation (e.g., when dΦrec/dt ∼ 0), we observe that super-Alfvénic shears tend to decelerate to sub-Alfvénic speeds, due in part to the growth of large plasmoids, the periodic boundary conditions, and the finite box size. We believe that an outflowing box setup would mitigate this late-time deceleration of the shear, but it would not strongly impact our measurements (presented below) of the reconnection rate and the particle energy distribution. These are performed much earlier in the simulation: before shear-flow deceleration linked to excessively large (periodic-boundary-induced) plasmoids mature.
4.2. Reconnection rate
We computed the reconnection rates for each shear simulation using the method outlined in Sect. 2.3. Figure 8 presents the reconnection rate, relative to its Vs = 0 reference value, as a function of the shear four-velocity, Us = VsΓs/c, normalized to the Alfvénic four-velocity,  . Our primary observation is that reconnection slows down with increasing shear speeds, dropping to about 20% of its reference rate once Us reaches 2UA. Notably, for super-Alfvénic speeds, the reconnection rate appears to follow a similar trend between the σ = 1 and σ = 10 cases, suggesting a potential universality in this behavior. We point out, however, a local enhancement of the reconnection rate for modest shear speeds (Us = UA/3) that occurs only for σd = 1. This feature is not clearly understood, but it might not be significant given the ∼10% uncertainty in the rate measurements reported in Sect. 2.3. This uncertainty is somewhat amplified by the fact that we normalized the four-velocities by the reconnection rate with no shear (which itself is also only accurate to roughly 10%). Similar considerations apply to the slight dip observed at σd = 10 (Us = 2UA/3). The overall decrease in the reconnection rate with increasing shear-flow velocity may be due to the loss of causal connection between the fast-moving upstream plasma and the nearly static X points.
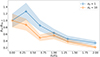 |
Fig. 8. Reconnection rate as a function of the shear-flow four-velocity, Us, in units of the Alfvén four-velocity, |

The general slowing of reconnection with increasing shear is in qualitative agreement with previous nonrelativistic studies (La Belle-Hamer et al. 1995; Cassak & Otto 2011; Cassak 2011). Quantitatively, however, these earlier works consistently indicate a thorough quenching of reconnection, with a very sharp cutoff near the Alfvén point. Our relativistic simulations, in contrast, show a much more gradual behavior across this point, and a complete shutdown of magnetic reconnection is not observed. This result is at odds with what has been recently reported by Peery et al. (2024), where relativistic reconnection is already quenched for shear speeds substantially below the Alfvén point. This may be explained by the nonzero guide field or by the small box size used in their simulations.
4.3. Implications for particle acceleration efficiency
To comprehend the impact of shear flow on particle acceleration efficiency, we present, in Fig. 9, the particle energy distributions measured when Φrec = 0.5Φ0, which occurs at differing simulation times due to the change in the laboratory-frame reconnection rate reported above. The initial distributions are shown on the figure with dashed lines for comparison. We observe that the high-energy power-law tail steepens with increasing shear. This is certainly true at low shear and seems to hold at high shear as well, though in the latter case (say, at Us ≥ 4UA/3) the initial plasma energy is so high that an unambiguous nonthermal component is less clear.
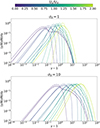 |
Fig. 9. Comparison of the particle energy distributions at a given magnetization for different shear values and Φrec = 0.5Φ0. Dashed lines represent the corresponding initial spectra. |
We also notice, for σd = 1, an emerging low-energy component in the distributions. Advection of particles from the upstream toward the plasmoids, where they lose their bulk motion energy, could explain this behavior, although only an analysis of particle trajectories could validate such a hypothesis. In summary, the presence of a shear flow decreases the particle acceleration efficiency: we observe a clear trend toward a softening of the particle energy distribution with increasing shear.
5. Conclusions
In this work, we separately analyzed the impacts of composition asymmetry and shear in the upstream plasma of a relativistic reconnecting current layer. For composition-asymmetric reconnection, the less magnetized electron-ion upstream side dictates the global reconnection dynamics, in agreement with Mbarek et al. (2022). The measured reconnection rate is very close to, although slightly higher than, that reported in previous symmetric electron-ion reconnection studies (Werner et al. 2018; Ball et al. 2018). Furthermore, we notice that the gap in the energy partition between electrons and ions increases by about 40% with respect to a symmetric electron-ion configuration, meaning that ions are even more preferentially heated in the presence of composition asymmetry. In the second part of our work, focused on a sheared reconnection layer, we show that a relativistic super-Alfvénic shear substantially reduces the reconnection rate but, unlike in nonrelativistic studies, does not completely halt reconnection. In addition, we observe a steepening of the power-law tail for increasing shear values.
These results have important implications for astrophysical environments. In the context of black hole accretion disks, asymmetric reconnection may occur at a jet-disk interface or during magnetic flux eruptions. One important asymmetry in such reconnection events is with respect to plasma composition. In this case, our results indicate that particle acceleration is dictated by the heavier – and, hence less magnetized – electron-ion side of the current sheet. Due to the modest ion magnetization expected in this environment (σ ≲ 1), reconnection is unlikely to produce prominent power-law tails in the ion energy distribution; a prominent nonthermal component exceeding γ = mi/meσ ≲ mi/me in the electron energy distribution is also not expected.
These properties suggest that asymmetric reconnection at a jet-disk boundary likely does not power the high-energy gamma-ray flares observed in black hole environments. On the other hand, such reconnection sites may contribute to the lower-energy emission observed in limb-brightened jets. The addition of a velocity shear along field lines at the jet-disk boundary does not change these expectations, since, as we show in this work, strong shear slows reconnection and inhibits nonthermal particle acceleration – effects that would only further hamper efficient acceleration of particles up to gamma-ray-emitting energies.
An important limitation of our study is its dimensionality. Once particles are trapped in 2D plasmoids, they are artificially kept from escaping back into the upstream plasma. However, in 3D, as shown by recent studies (Zhang et al. 2021; Chernoglazov et al. 2023), ions can escape plasmoids, get onto Speiser-like trajectories, and undergo intense linear acceleration. In the presence of composition asymmetry, this mechanism may facilitate the mixing of ions into the putatively Poynting-flux-dominated and pair-loaded jet. It may also facilitate particle injection into other acceleration processes occurring on larger scales, such as, shear-flow acceleration along the jet sheath (Ostrowski 1998; Rieger & Duffy 2004; Sironi et al. 2021). This motivates future studies of 3D composition-asymmetric relativistic magnetic reconnection.
Data availability
Movies associated to Figs. 2 and 7 are available at https://www.aanda.org
Acknowledgments
We thank Jesse Vos for providing us early results from his GRMHD simulations and for fruitful discussions regarding magnetized black-hole accretion. We are thankful to the referee’s comments that helped us improving the quality of the manuscript. This project has received funding from the European Research Council (ERC) under the European Union’s Horizon 2020 research and innovation program (Grant Agreement No. 863412). Computing resources were provided by TGCC under the allocation A0150407669 made by GENCI.
References
- Ball, D., Özel, F., Psaltis, D., & Chan, C.-K. 2016, ApJ, 826, 77 [NASA ADS] [CrossRef] [Google Scholar]
- Ball, D., Sironi, L., & Özel, F. 2018, ApJ, 862, 80 [Google Scholar]
- Blandford, R. D., & Znajek, R. L. 1977, MNRAS, 179, 433 [NASA ADS] [CrossRef] [Google Scholar]
- Cassak, P. A. 2011, Phys. Plasmas, 18, 072106 [NASA ADS] [CrossRef] [Google Scholar]
- Cassak, P. A., & Otto, A. 2011, Phys. Plasmas, 18, 074501 [NASA ADS] [CrossRef] [Google Scholar]
- Cerutti, B., & Giacinti, G. 2020, A&A, 642, A123 [NASA ADS] [CrossRef] [EDP Sciences] [Google Scholar]
- Cerutti, B., & Werner, G. 2019, Astrophysics Source Code Library [record ascl:1911.012] [Google Scholar]
- Cerutti, B., Werner, G. R., Uzdensky, D. A., & Begelman, M. C. 2012a, ApJ, 754, L33 [NASA ADS] [CrossRef] [Google Scholar]
- Cerutti, B., Uzdensky, D. A., & Begelman, M. C. 2012b, ApJ, 746, 148 [Google Scholar]
- Cerutti, B., Werner, G. R., Uzdensky, D. A., & Begelman, M. C. 2013, ApJ, 770, 147 [Google Scholar]
- Cerutti, B., Philippov, A. A., & Spitkovsky, A. 2016, MNRAS, 457, 2401 [Google Scholar]
- Chashkina, A., Bromberg, O., & Levinson, A. 2021, MNRAS, 508, 1241 [NASA ADS] [CrossRef] [Google Scholar]
- Chernoglazov, A., Hakobyan, H., & Philippov, A. 2023, ApJ, 959, 122 [NASA ADS] [CrossRef] [Google Scholar]
- Chow, A., Rowan, M. E., Sironi, L., et al. 2023, MNRAS, 524, 90 [CrossRef] [Google Scholar]
- Comisso, L., & Sironi, L. 2018, Phys. Rev. Lett., 121, 255101 [NASA ADS] [CrossRef] [Google Scholar]
- Crinquand, B., Cerutti, B., Dubus, G., Parfrey, K., & Philippov, A. 2021, A&A, 650, A163 [NASA ADS] [CrossRef] [EDP Sciences] [Google Scholar]
- Eastwood, J. P., Phan, T. D., Øieroset, M., et al. 2013, Plasma Phys. Control. Fusion, 55, 124001 [CrossRef] [Google Scholar]
- El Mellah, I., Cerutti, B., Crinquand, B., & Parfrey, K. 2022, A&A, 663, A169 [NASA ADS] [CrossRef] [EDP Sciences] [Google Scholar]
- El Mellah, I., Cerutti, B., & Crinquand, B. 2023, A&A, 677, A67 [NASA ADS] [CrossRef] [EDP Sciences] [Google Scholar]
- Giannios, D., Uzdensky, D. A., & Begelman, M. C. 2009, MNRAS, 395, L29 [NASA ADS] [CrossRef] [Google Scholar]
- Guo, F., Li, H., Daughton, W., & Liu, Y.-H. 2014, Phys. Rev. Lett., 113, 155005 [Google Scholar]
- Hakobyan, H., Philippov, A., & Spitkovsky, A. 2019, ApJ, 877, 53 [NASA ADS] [CrossRef] [Google Scholar]
- Hakobyan, H., Ripperda, B., & Philippov, A. A. 2023, ApJ, 943, L29 [Google Scholar]
- Hoshino, M., & Lyubarsky, Y. 2012, Space Sci. Rev., 173, 521 [Google Scholar]
- Hoshino, M., Mukai, T., Terasawa, T., & Shinohara, I. 2001, J. Geophys. Res., 106, 25979 [NASA ADS] [CrossRef] [Google Scholar]
- Igumenshchev, I. V. 2008, ApJ, 677, 317 [NASA ADS] [CrossRef] [Google Scholar]
- Jaroschek, C. H., & Hoshino, M. 2009, Phys. Rev. Lett., 103, 075002 [NASA ADS] [CrossRef] [Google Scholar]
- Kagan, D., Sironi, L., Cerutti, B., & Giannios, D. 2015, Space Sci. Rev., 191, 545 [NASA ADS] [CrossRef] [Google Scholar]
- Kirk, J. G., & Skjæraasen, O. 2003, ApJ, 591, 366 [CrossRef] [Google Scholar]
- La Belle-Hamer, A. L., Otto, A., & Lee, L. C. 1995, J. Geophys. Res., 100, 11875 [NASA ADS] [Google Scholar]
- Langdon, A. B., & Birdsall, C. K. 1970, Phys. Fluids, 13, 2115 [NASA ADS] [CrossRef] [Google Scholar]
- Lu, R.-S., Asada, K., Krichbaum, T. P., et al. 2023, Nature, 616, 686 [CrossRef] [Google Scholar]
- Lyubarskii, Y. E. 1996, A&A, 311, 172 [NASA ADS] [Google Scholar]
- Lyutikov, M. 2003, MNRAS, 346, 540 [Google Scholar]
- Mahlmann, J. F., Philippov, A. A., Levinson, A., Spitkovsky, A., & Hakobyan, H. 2022, ApJ, 932, L20 [NASA ADS] [CrossRef] [Google Scholar]
- Mbarek, R., Haggerty, C., Sironi, L., Shay, M., & Caprioli, D. 2022, Phys. Rev. Lett., 128, 145101 [NASA ADS] [CrossRef] [Google Scholar]
- Mehlhaff, J. M., Werner, G. R., Uzdensky, D. A., & Begelman, M. C. 2020, MNRAS, 498, 799 [NASA ADS] [CrossRef] [Google Scholar]
- Mehlhaff, J., Werner, G., Cerutti, B., Uzdensky, D., & Begelman, M. 2024, MNRAS, 527, 11587 [Google Scholar]
- Melzani, M., Walder, R., Folini, D., Winisdoerffer, C., & Favre, J. M. 2014, A&A, 570, A112 [NASA ADS] [CrossRef] [EDP Sciences] [Google Scholar]
- Meringolo, C., Cruz-Osorio, A., Rezzolla, L., & Servidio, S. 2023, ApJ, 944, 122 [NASA ADS] [CrossRef] [Google Scholar]
- Murphy, N. A., Miralles, M. P., Pope, C. L., et al. 2012, ApJ, 751, 56 [NASA ADS] [CrossRef] [Google Scholar]
- Nalewajko, K., Giannios, D., Begelman, M. C., Uzdensky, D. A., & Sikora, M. 2011, MNRAS, 413, 333 [NASA ADS] [CrossRef] [Google Scholar]
- Ostrowski, M. 1998, A&A, 335, 134 [NASA ADS] [Google Scholar]
- Parfrey, K., Giannios, D., & Beloborodov, A. M. 2015, MNRAS, 446, L61 [Google Scholar]
- Peery, S., Liu, Y.-H., & Li, X. 2024, ApJ, 964, 144 [NASA ADS] [CrossRef] [Google Scholar]
- Petropoulou, M., Giannios, D., & Sironi, L. 2016, MNRAS, 462, 3325 [NASA ADS] [CrossRef] [Google Scholar]
- Rieger, F. M., & Duffy, P. 2004, ApJ, 617, 155 [NASA ADS] [CrossRef] [Google Scholar]
- Ripperda, B., Bacchini, F., & Philippov, A. A. 2020, ApJ, 900, 100 [NASA ADS] [CrossRef] [Google Scholar]
- Ripperda, B., Liska, M., Chatterjee, K., et al. 2022, ApJ, 924, L32 [NASA ADS] [CrossRef] [Google Scholar]
- Scepi, N., Dexter, J., & Begelman, M. C. 2022, MNRAS, 511, 3536 [NASA ADS] [CrossRef] [Google Scholar]
- Schoeffler, K. M., Grismayer, T., Uzdensky, D., Fonseca, R. A., & Silva, L. O. 2019, ApJ, 870, 49 [NASA ADS] [CrossRef] [Google Scholar]
- Sironi, L., & Spitkovsky, A. 2014, ApJ, 783, L21 [NASA ADS] [CrossRef] [Google Scholar]
- Sironi, L., Rowan, M. E., & Narayan, R. 2021, ApJ, 907, L44 [CrossRef] [Google Scholar]
- Stathopoulos, S. I., Petropoulou, M., Sironi, L., & Giannios, D. 2024, ArXiv e-prints [arXiv:2406.01211] [Google Scholar]
- Swisdak, M. 2013, Phys. Plasmas, 20, 062110 [NASA ADS] [CrossRef] [Google Scholar]
- Tchekhovskoy, A., Narayan, R., & McKinney, J. C. 2011, MNRAS, 418, L79 [NASA ADS] [CrossRef] [Google Scholar]
- Uzdensky, D. A., & Spitkovsky, A. 2014, ApJ, 780, 3 [NASA ADS] [Google Scholar]
- Uzdensky, D. A., Cerutti, B., & Begelman, M. C. 2011, ApJ, 737, L40 [NASA ADS] [CrossRef] [Google Scholar]
- Vos, J. T., Olivares, H., Cerutti, B., & Mościbrodzka, M. 2024, MNRAS, 531, 1554 [NASA ADS] [CrossRef] [Google Scholar]
- Werner, G. R., Uzdensky, D. A., Cerutti, B., Nalewajko, K., & Begelman, M. C. 2016, ApJ, 816, L8 [Google Scholar]
- Werner, G. R., Uzdensky, D. A., Begelman, M. C., Cerutti, B., & Nalewajko, K. 2018, MNRAS, 473, 4840 [Google Scholar]
- Yuan, Y., Spitkovsky, A., Blandford, R. D., & Wilkins, D. R. 2019, MNRAS, 487, 4114 [NASA ADS] [CrossRef] [Google Scholar]
- Yuan, Y., Beloborodov, A. M., Chen, A. Y., & Levin, Y. 2020, ApJ, 900, L21 [NASA ADS] [CrossRef] [Google Scholar]
- Zhang, H., Sironi, L., & Giannios, D. 2021, ApJ, 922, 261 [NASA ADS] [CrossRef] [Google Scholar]
- Zhdankin, V., Werner, G. R., Uzdensky, D. A., & Begelman, M. C. 2017, Phys. Rev. Lett., 118, 055103 [NASA ADS] [CrossRef] [Google Scholar]
- Zhdankin, V., Ripperda, B., & Philippov, A. A. 2023, Phys. Rev. Res., 5, 043023 [NASA ADS] [CrossRef] [Google Scholar]
- Zweibel, E. G., & Yamada, M. 2009, ARA&A, 47, 291 [Google Scholar]
All Tables
All Figures
|
Fig. 1. Sketch of the simulation setup. The dashed red line separates the pair plasma on the jet side (upper half) from the electron-ion plasma on the disk side (bottom half). Shear flow is parallel to the magnetic field on each side. “BC” stands for “boundary conditions”. |
| In the text | |
|
Fig. 2. Plasma number density in the composition asymmetric setup (no shear) shown in the middle of the reconnection process (top left panel; Φrec ∼ 0.15Φ0) and toward the saturation stage (bottom left panel; Φrec ∼ 0.45Φ0) for σd = 0.1, β = 10−3, and σj = 5 (run SD01B0001). White contours represent magnetic field lines. We provide in the top and bottom right panels a plot of different quantities for the slice shown by the dashed green line on the density maps. The blue curve represents the x component of the magnetic field, and the red curve represents the plasma mass density, ρ (in logarithmic scale). The box midplane is represented by the dashed black lines. For the time evolution, see the online animation. |
| In the text | |
|
Fig. 3. Plasma number density mixing (left panels) defined as (nj − nd)/(nd + nj), and plasma kinetic energy density mixing (right panels) defined as (ϵj − ϵd)/(ϵd + ϵj), where ϵj/d = γnj/dmc2, in the early (top panels; Φrec ∼ 0.15Φ0) and late (bottom panels; Φrec ∼ 0.5Φ0) stages of the simulation. Here, σd = 0.3 and β = 10−2 (run SD03B001). |
| In the text | |
|
Fig. 4. Energy partition between the electron-ion (disk) plasma and the pair (jet) plasma at the stage when half of the initial magnetic flux has reconnected, Φrec = 0.5Φ0. |
| In the text | |
|
Fig. 5. Particle energy distributions for all species at the end of the σd = 0.1 (SD01B0001; top panel) and σd = 1 (SD1B0001; bottom panel) runs, for β = 10−3. |
| In the text | |
|
Fig. 6. Same as the top panel in Fig. 5 but with identical plasma properties on the two sides (i.e., symmetric reconnection with σj = σd = 0.1 and β = 10−3, run S01B0001SYM). |
| In the text | |
|
Fig. 7. Simulation of pair-plasma relativistic magnetic reconnection with an antisymmetric shear applied along the current layer. Top: Plasma number density. Bottom: Mixing of both upstream plasmas as in Fig. 3. Here, σd = 1, Us = 2UA (run SD1US6), and the white contours represent the magnetic field lines. For the time evolution, see the online animation. |
| In the text | |
|
Fig. 8. Reconnection rate as a function of the shear-flow four-velocity, Us, in units of the Alfvén four-velocity, |
| In the text | |
|
Fig. 9. Comparison of the particle energy distributions at a given magnetization for different shear values and Φrec = 0.5Φ0. Dashed lines represent the corresponding initial spectra. |
| In the text | |
Current usage metrics show cumulative count of Article Views (full-text article views including HTML views, PDF and ePub downloads, according to the available data) and Abstracts Views on Vision4Press platform.
Data correspond to usage on the plateform after 2015. The current usage metrics is available 48-96 hours after online publication and is updated daily on week days.
Initial download of the metrics may take a while.