Fig. 2.
Download original image
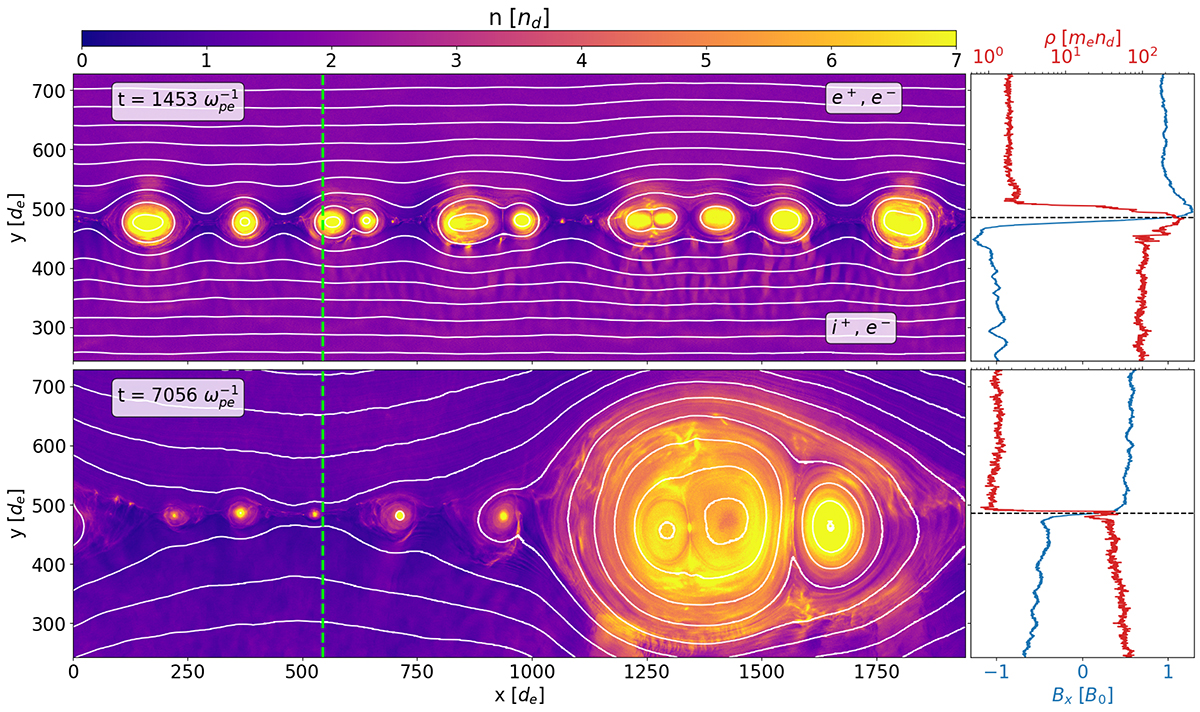
Plasma number density in the composition asymmetric setup (no shear) shown in the middle of the reconnection process (top left panel; Φrec ∼ 0.15Φ0) and toward the saturation stage (bottom left panel; Φrec ∼ 0.45Φ0) for σd = 0.1, β = 10−3, and σj = 5 (run SD01B0001). White contours represent magnetic field lines. We provide in the top and bottom right panels a plot of different quantities for the slice shown by the dashed green line on the density maps. The blue curve represents the x component of the magnetic field, and the red curve represents the plasma mass density, ρ (in logarithmic scale). The box midplane is represented by the dashed black lines. For the time evolution, see the online animation.
Current usage metrics show cumulative count of Article Views (full-text article views including HTML views, PDF and ePub downloads, according to the available data) and Abstracts Views on Vision4Press platform.
Data correspond to usage on the plateform after 2015. The current usage metrics is available 48-96 hours after online publication and is updated daily on week days.
Initial download of the metrics may take a while.