Fig. 3
Download original image
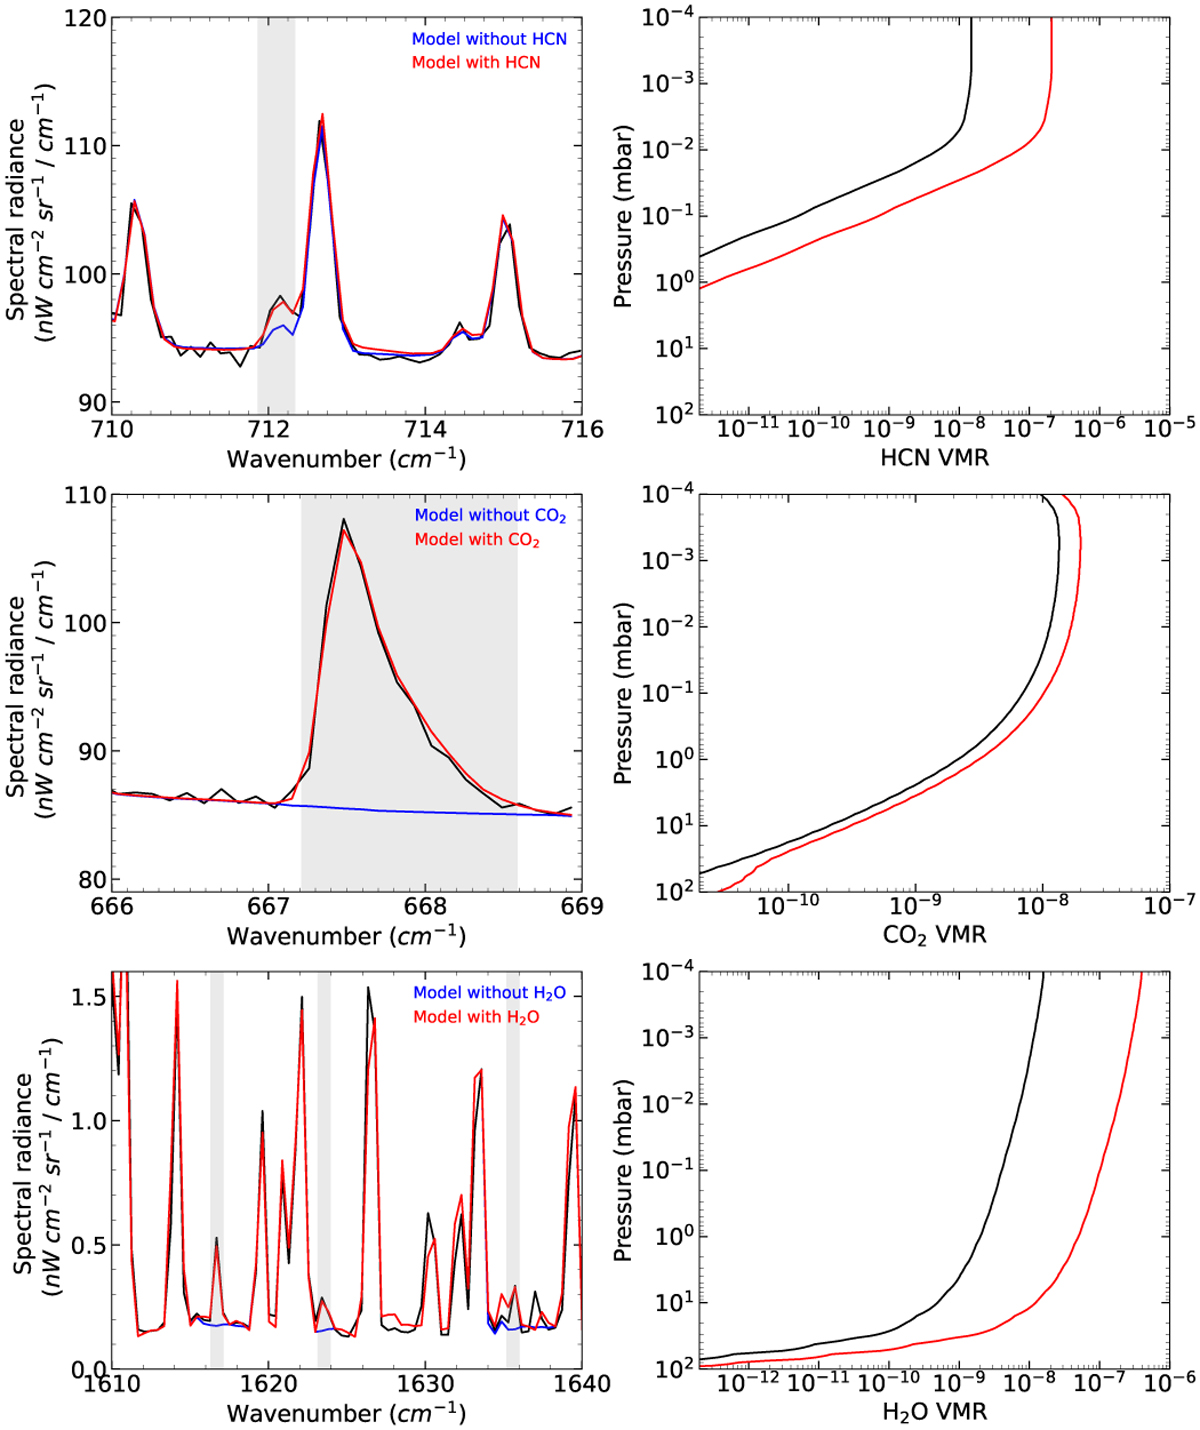
Left: difference in modelled zonally averaged spectra when HCN (55∘S), CO2 (65∘S), and H2O (75∘S) are added (red) and when they are not present (blue) compared with the observations (black). Right: vertical profiles retrieved for each of the molecules. The black profiles corresponds to the a priori profiles used. The red profiles correspond to the retrieved vertical profile for each spectra.
Current usage metrics show cumulative count of Article Views (full-text article views including HTML views, PDF and ePub downloads, according to the available data) and Abstracts Views on Vision4Press platform.
Data correspond to usage on the plateform after 2015. The current usage metrics is available 48-96 hours after online publication and is updated daily on week days.
Initial download of the metrics may take a while.