Fig. 2
Download original image
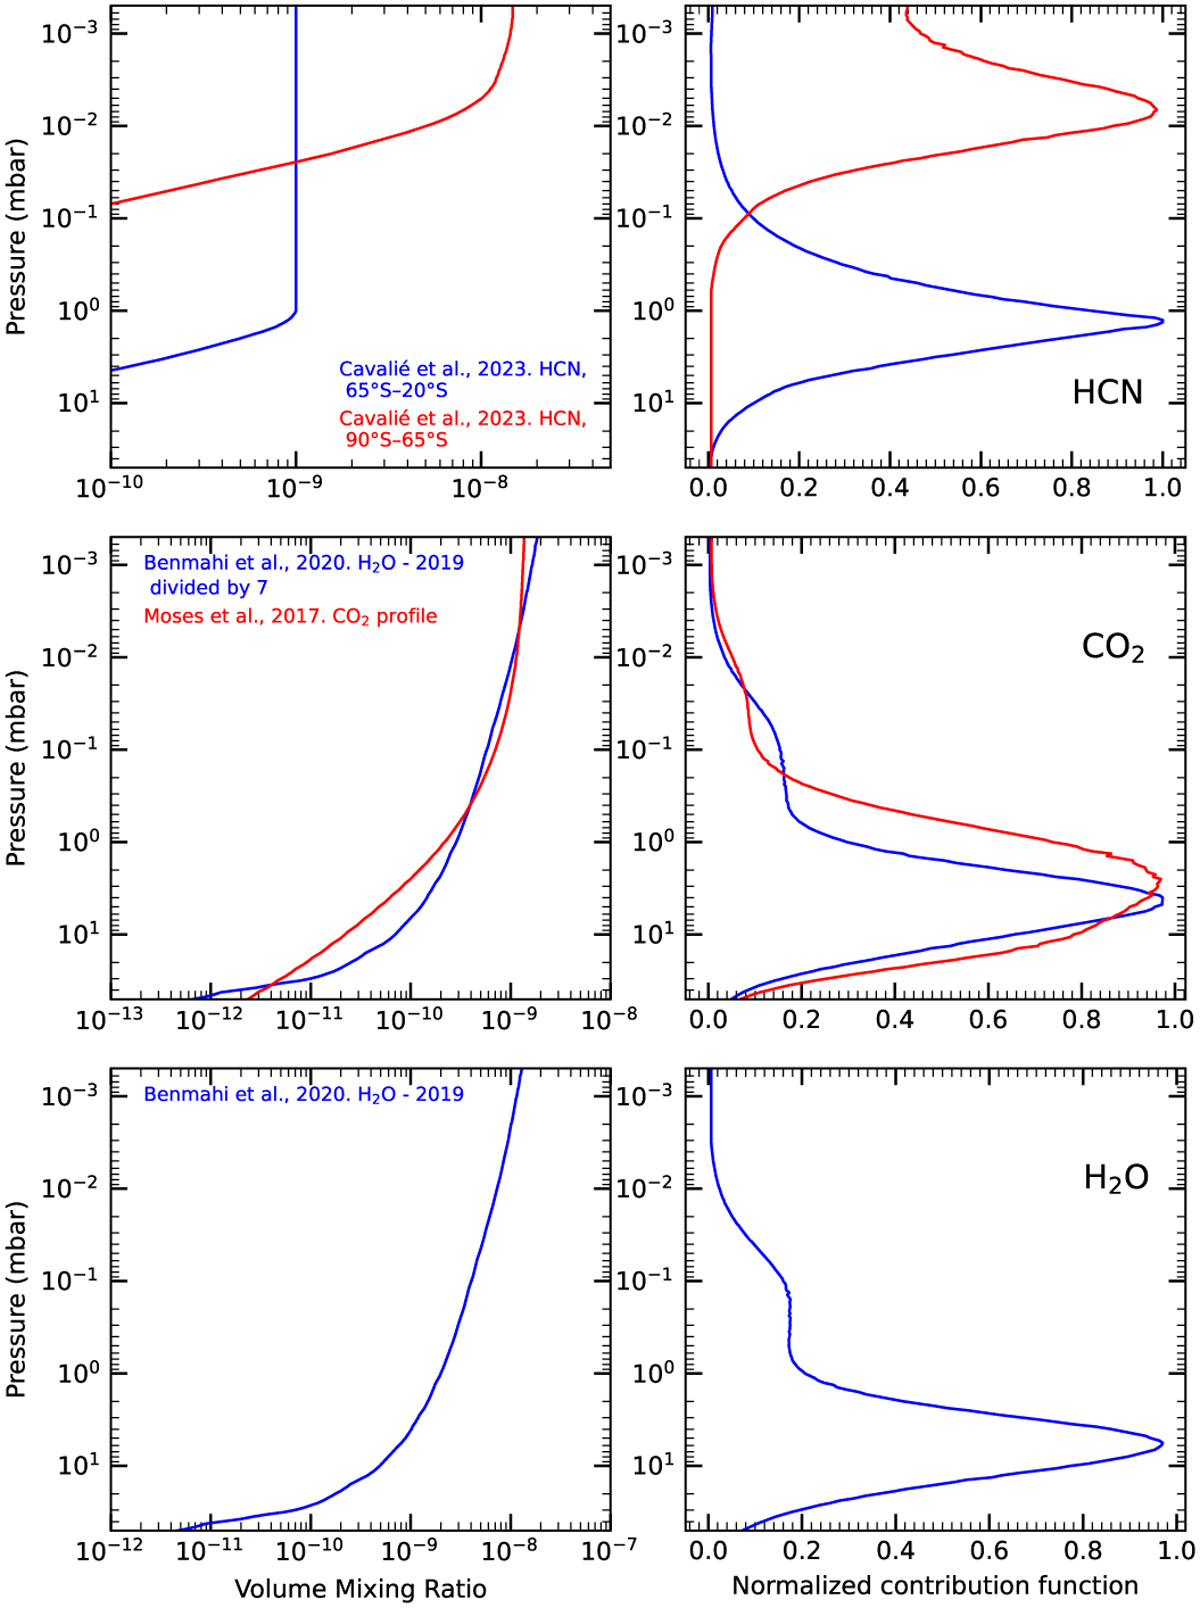
Left column: different vertical profiles used in this work for the three molecules (HCN, CO2, and H2 O) analysed in this work. Right column: contribution functions for the different profiles of each molecule. For CO2 and H2O, the contribution functions correspond to a mean latitude of 60∘S, while for HCN they correspond to a mean latitude of 60∘S for the blue profile, and 75∘S for the red profile.
Current usage metrics show cumulative count of Article Views (full-text article views including HTML views, PDF and ePub downloads, according to the available data) and Abstracts Views on Vision4Press platform.
Data correspond to usage on the plateform after 2015. The current usage metrics is available 48-96 hours after online publication and is updated daily on week days.
Initial download of the metrics may take a while.