Fig. 1
Download original image
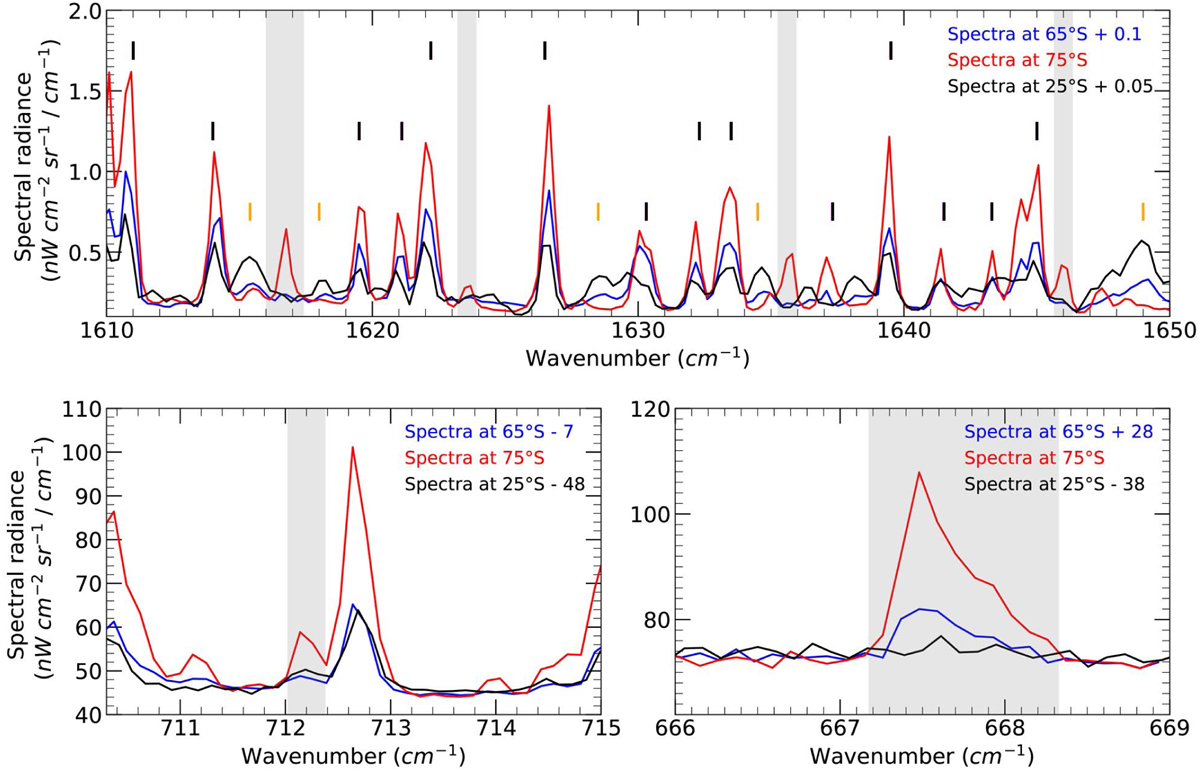
Top panel: example of Jupiter spectral region (zonally averaged) encompassing CH4 lines and the H2O v2 lines at 75∘S (red), 65∘S (blue) and 25∘S (black). The vertical lines display the spectral features of CH4 (black) and NH3 (orange). Bottom left panel: same but for HCN v2 band (zonally averaged) next to C2H2 lines. Bottom right panel: same but for CO2 v2 band. The grey regions mark the positions of the emission lines of each molecule. The spectra at 65∘S is shifted to match the continuum emission of the 75∘S spectrum. The offset values in nWcm−2sr−1/cm−1 are indicated in the legend of each panel.
Current usage metrics show cumulative count of Article Views (full-text article views including HTML views, PDF and ePub downloads, according to the available data) and Abstracts Views on Vision4Press platform.
Data correspond to usage on the plateform after 2015. The current usage metrics is available 48-96 hours after online publication and is updated daily on week days.
Initial download of the metrics may take a while.