Fig. 5
Download original image
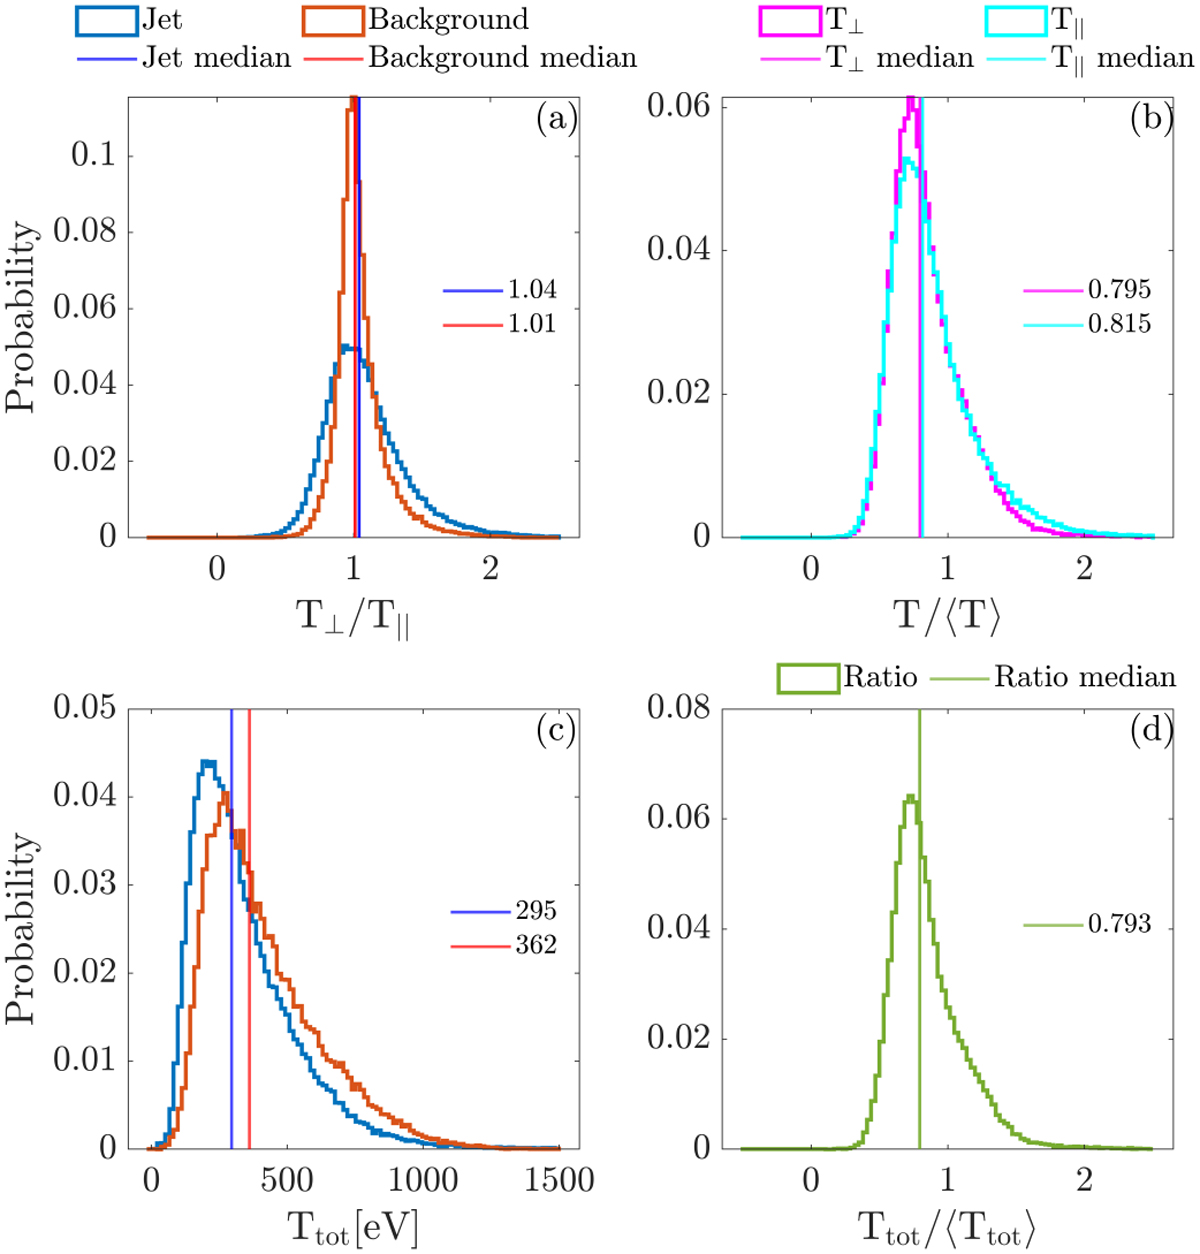
Distributions of ion temperature. The graphs show the following: (a) the ratio T⊥/T|| for the jets and the background, (b) the ratio of the jet maximum to the background for components T⊥ and T||, (c) the distribution functions for the jet maximums and the background, and (d) the ratio of the jet maximum to the background for the total temperature. The vertical lines signify the medians of the distributions.
Current usage metrics show cumulative count of Article Views (full-text article views including HTML views, PDF and ePub downloads, according to the available data) and Abstracts Views on Vision4Press platform.
Data correspond to usage on the plateform after 2015. The current usage metrics is available 48-96 hours after online publication and is updated daily on week days.
Initial download of the metrics may take a while.