Fig. 4
Download original image
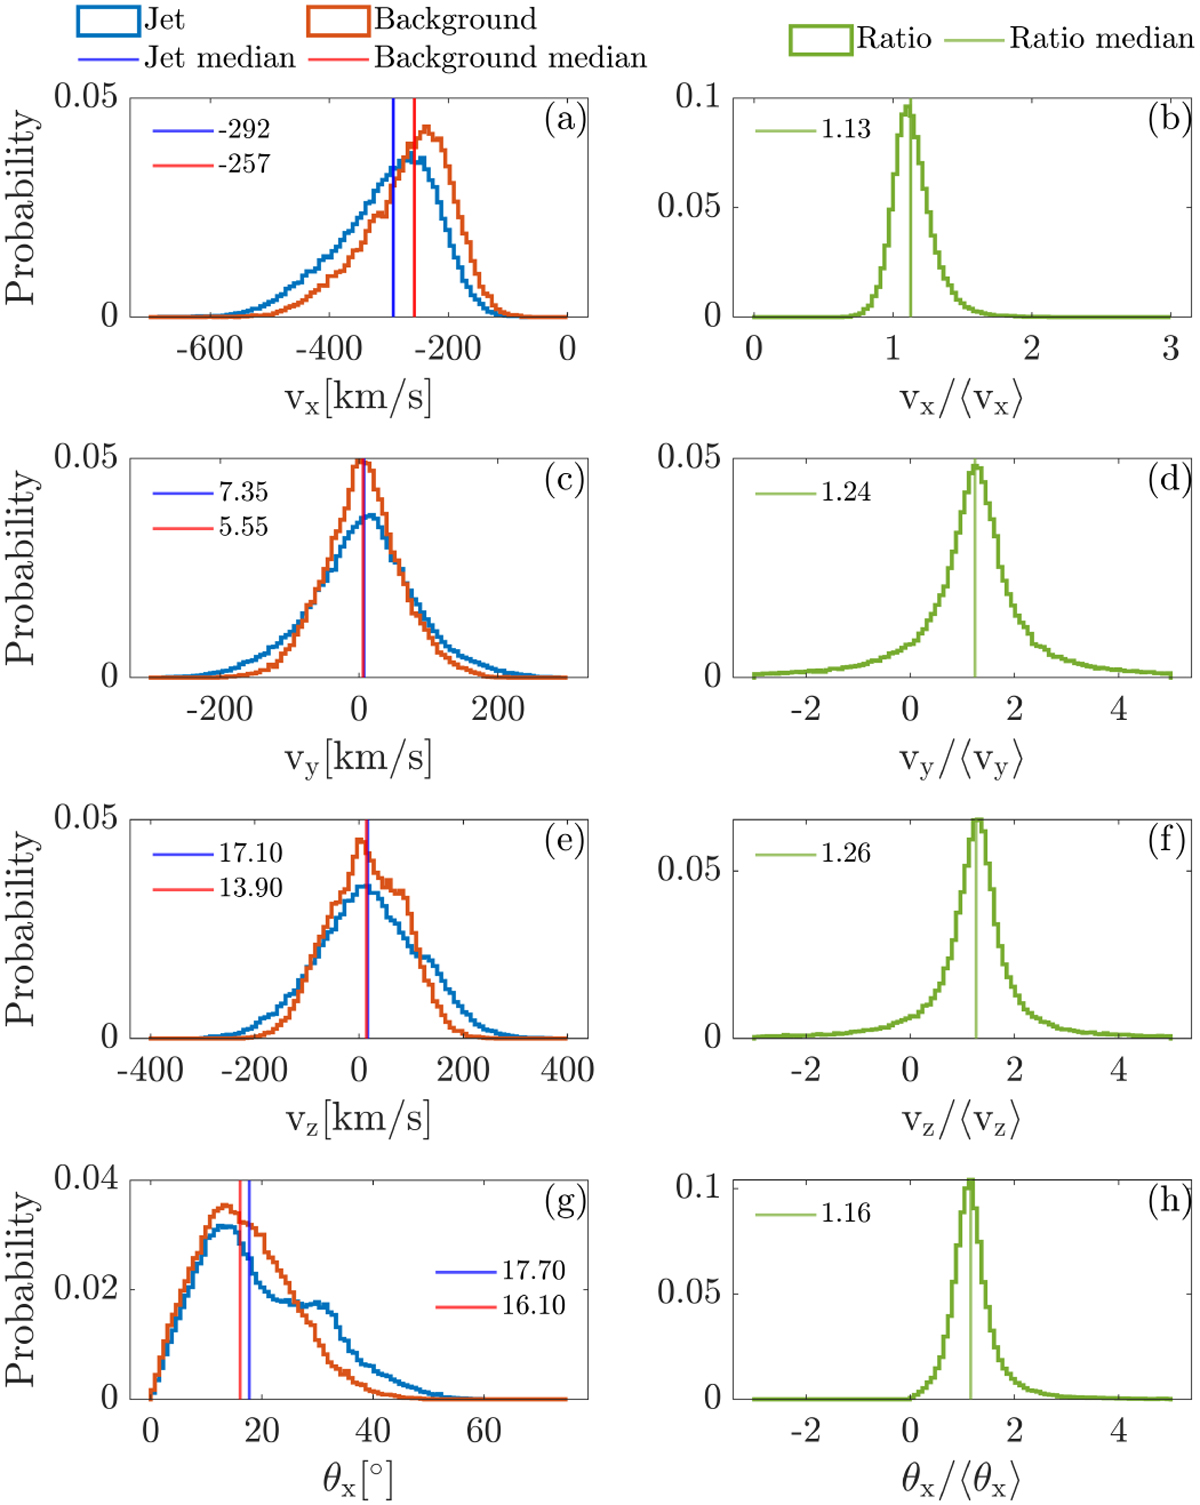
Distributions of the velocity components, vx,y,z, and the deflection angle, θx. The left column shows the distributions of these quantities for the jets and for the background. The jet values represent the maximum value measured inside the jet. In the right column, the ratio between the maximum and the background averages is shown. The vertical lines show the median values.
Current usage metrics show cumulative count of Article Views (full-text article views including HTML views, PDF and ePub downloads, according to the available data) and Abstracts Views on Vision4Press platform.
Data correspond to usage on the plateform after 2015. The current usage metrics is available 48-96 hours after online publication and is updated daily on week days.
Initial download of the metrics may take a while.