Fig. 8.
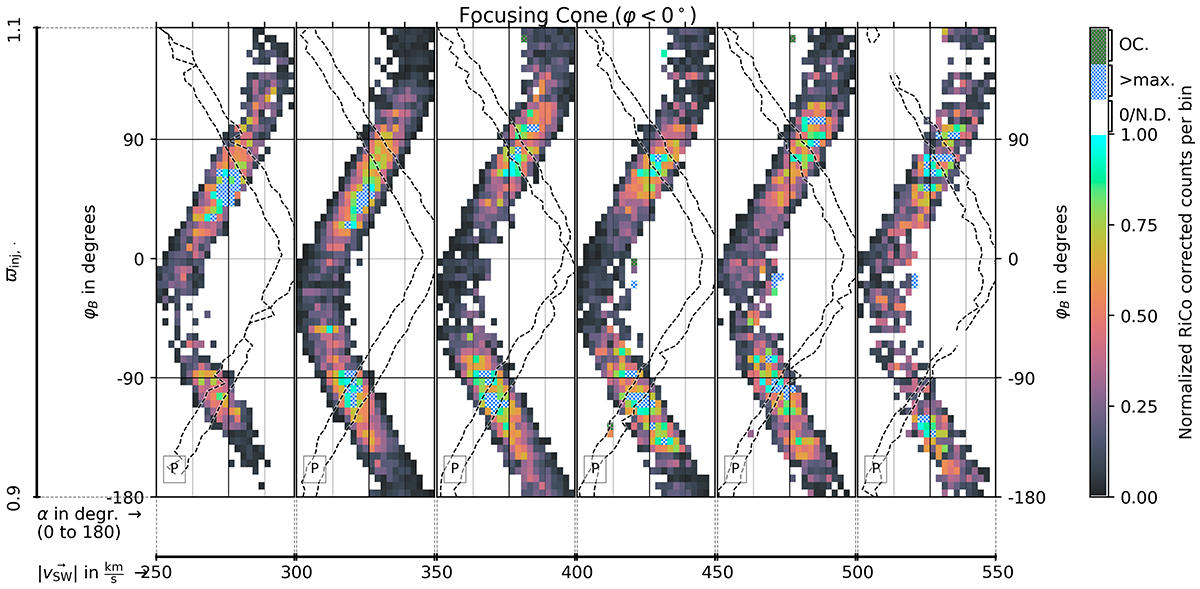
Download original image
2D histograms of the pitch angle (x-axis, from 0° to 180°; one tick equals 45°) and the magnetic field azimuthal angle (y-axis, from −180° to 180°). The histograms are analogously structured and normalised as in Fig. C.1, except that only the row for 0.95 ≤ ϖinj, P ≤ 1.05 is shown, the observations are restricted to the region of the focusing cone, and each column refers to observations associated with a different SW velocity vSW.
Current usage metrics show cumulative count of Article Views (full-text article views including HTML views, PDF and ePub downloads, according to the available data) and Abstracts Views on Vision4Press platform.
Data correspond to usage on the plateform after 2015. The current usage metrics is available 48-96 hours after online publication and is updated daily on week days.
Initial download of the metrics may take a while.