Fig. 7.
Download original image
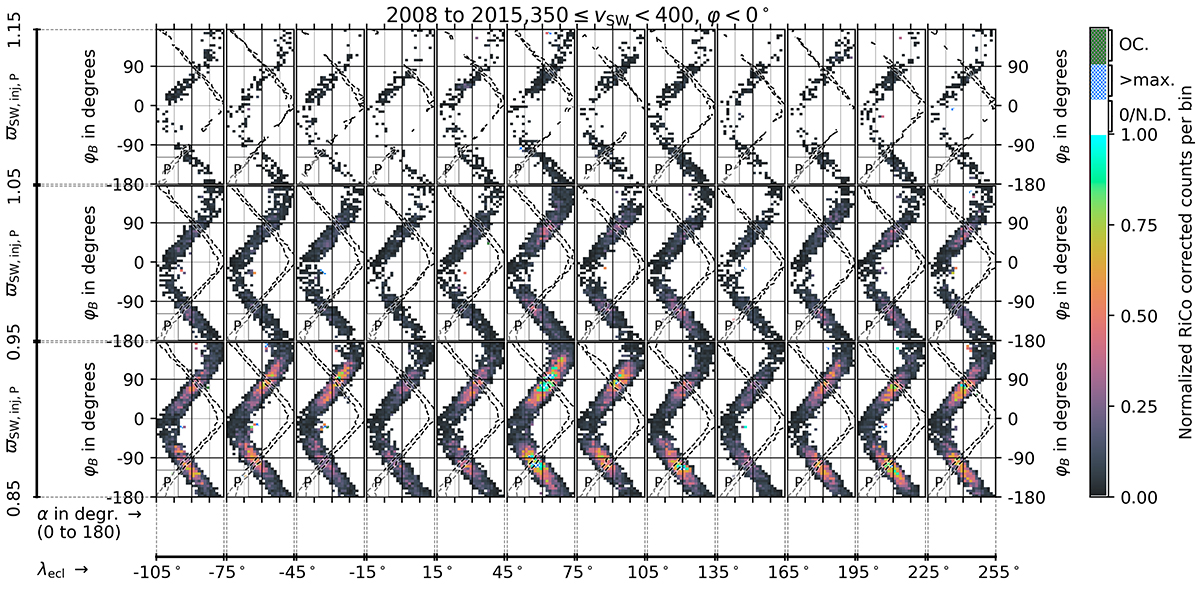
2D histograms of pitch angle (x-axis, from 0° to 180°; one tick equals 45°) and magnetic field azimuthal angle (y-axis, from −180° to 180°). The entirety of histograms is structured as a matrix. In each cell, the pitch-angle histograms for the primary ISN trajectory (P) are shown, and each row of histograms is filtered for a different ϖinj, P. The value range for a histogram is indicated on the left line. Each histogram is labelled P to indicate that all observations were treated as coming from the primary trajectory. Each column of histograms represents a different ecliptic longitude that is indicated on the bottom line. All histograms share the same global maximum after the normalisation steps displayed in Fig. 4 were applied. The dashed lines show the range of initial pitch angles to be expected at a given magnetic field azimuthal angle. In addition, a SW filter was applied (300 km/s ≤ vSW ≤ 450 km/s), and only data from the φ < 0° half of the instrument are shown here.
Current usage metrics show cumulative count of Article Views (full-text article views including HTML views, PDF and ePub downloads, according to the available data) and Abstracts Views on Vision4Press platform.
Data correspond to usage on the plateform after 2015. The current usage metrics is available 48-96 hours after online publication and is updated daily on week days.
Initial download of the metrics may take a while.