Fig. 5.
Download original image
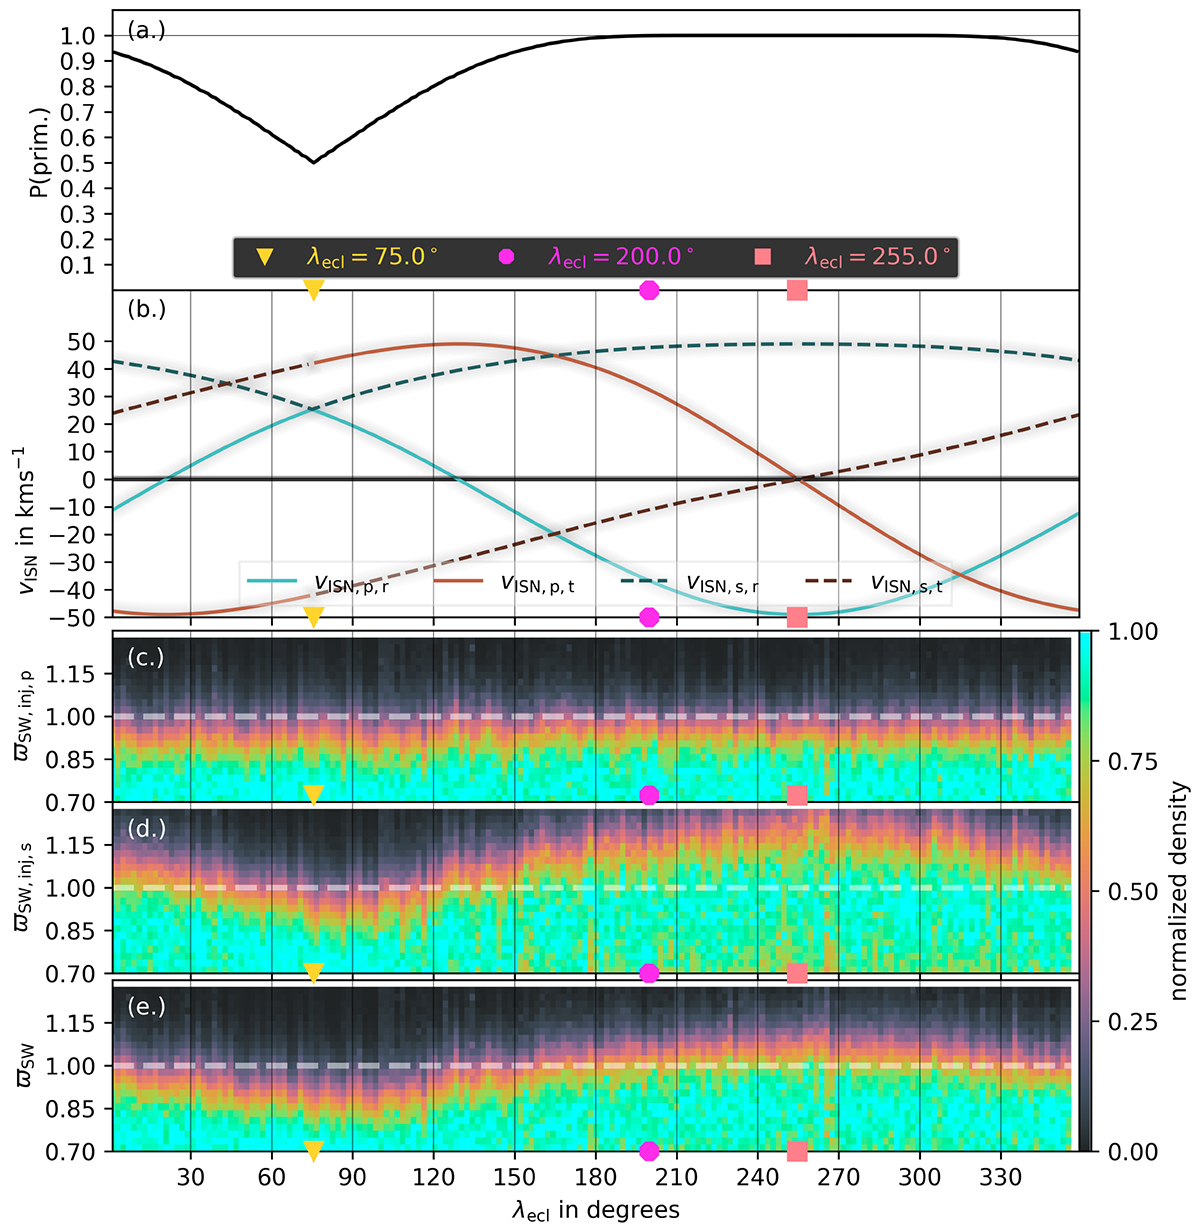
ISN densities and velocities and the impact of the ISN velocities on relative velocity measures for PUIs over ecliptic longitude. All panels share a common x-axis and are a function of the ecliptic longitude. Panel a shows the fraction of primary ISN density, and panel b shows the radial and tangential components of the ISN velocity. Panel c shows spectra of ϖSW, inj, p, panel d shows spectra of ϖSW, inj, s and panel e shows spectra of ϖSW. All spectra are normalised to the respective maximum of the ecliptic longitude slices. The different symbols at the x-axes correspond to different ecliptic longitudes that correspond in heliospheric position to the markers in Fig. B.1: Focusing cone (yellow triangle), crescent (light pink square), and intermediate (magenta circle) position.
Current usage metrics show cumulative count of Article Views (full-text article views including HTML views, PDF and ePub downloads, according to the available data) and Abstracts Views on Vision4Press platform.
Data correspond to usage on the plateform after 2015. The current usage metrics is available 48-96 hours after online publication and is updated daily on week days.
Initial download of the metrics may take a while.