Fig. 4.
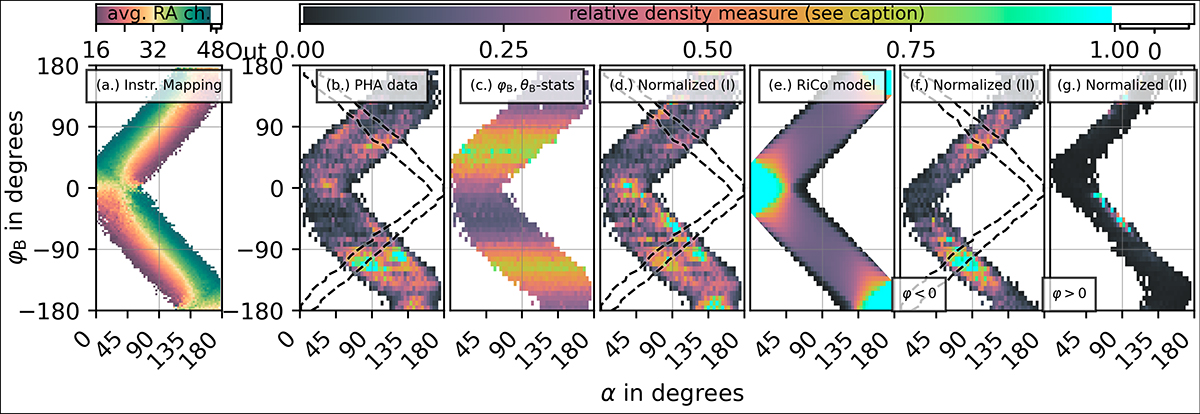
Download original image
Overview of instrumental resistive anode mapping (a) and normalisations (b to g) applied to the He+ data. All plots depict a quantity as a function of pitch angle (x-axis) and magnetic field azimuthal angle (y-axis). All identified He+ events are selected for which the conditions 0.9 < ϖinj, p < 1.1, π/16 < ϑB < π/16 and |λecl − 75|< 32 apply. Panel a depicts the average position channel measured by the PLASTIC resistive anode (average resistive anode channel, av. RA ch.). Panel b depicts He+ PHA data as counts per bin. Panel c depicts weights based on the number of instrumental weighting cycles during which the magnetic field angle was observed. These are applied in a first normalisation step. The result is shown in panel d as normalised counts per bin. Panel e depicts weights based on the coverage of a particle gyro orbit within the aperture of PLASTIC. Panels f and g depict the result of normalisation by these weights. The data from the φ < 0° and φ > 0° halves of SWS are separately depicted in panel f and panel g, respectively.
Current usage metrics show cumulative count of Article Views (full-text article views including HTML views, PDF and ePub downloads, according to the available data) and Abstracts Views on Vision4Press platform.
Data correspond to usage on the plateform after 2015. The current usage metrics is available 48-96 hours after online publication and is updated daily on week days.
Initial download of the metrics may take a while.