Fig. 2.
Download original image
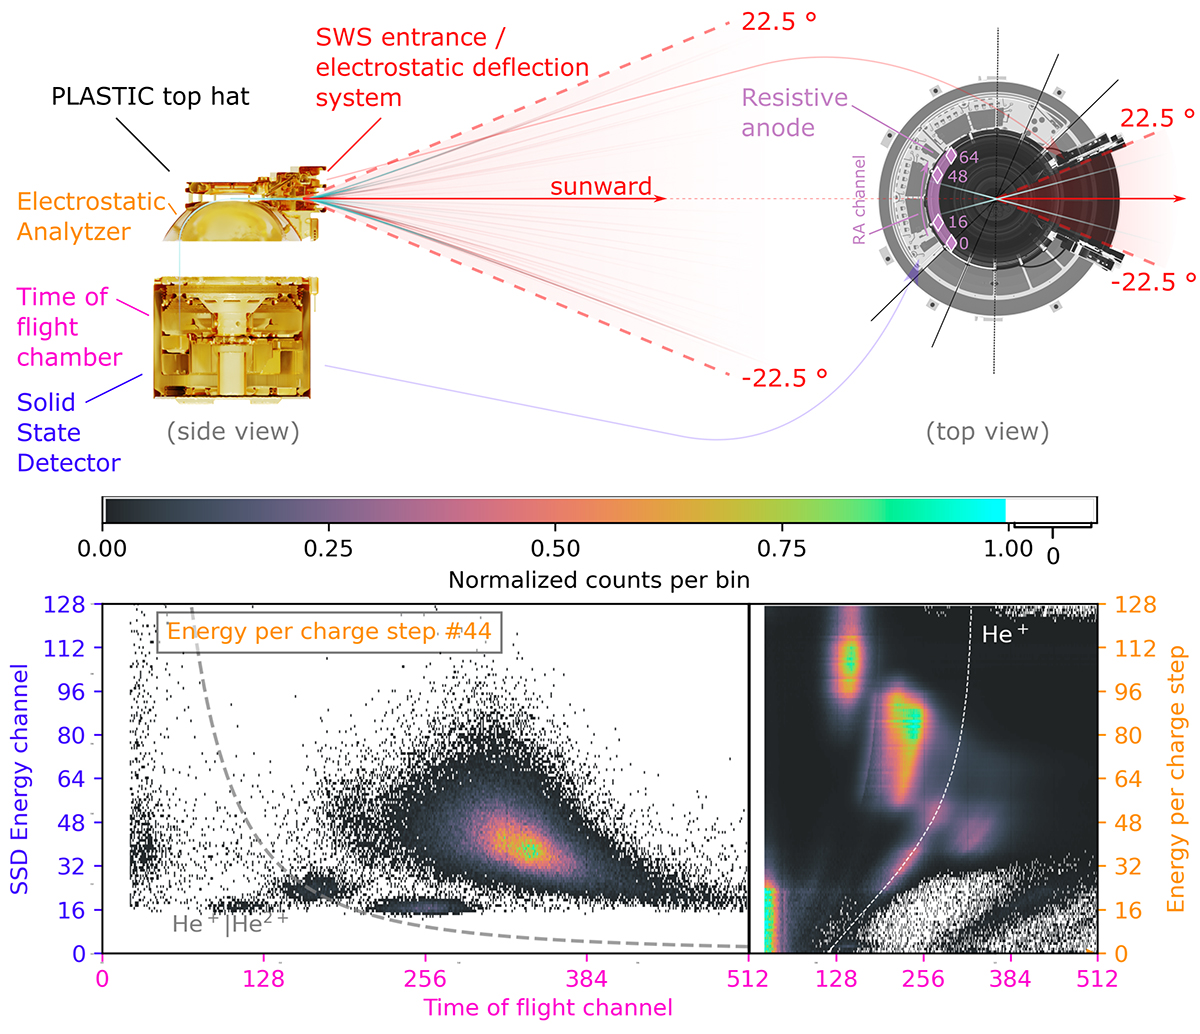
Top left: Rendered side view of PLASTIC (cut in half). The entrance of the top hat of the cylindrical sensor is separated into two parts: The solar wind sector (SWS), and the wide-angle partition. Within the top hat, the electrostatic analyser is housed. In the lower parts of the instrument, the time-of-flight chamber and an solid state detector (SSD) are found. An example trajectory that enters the tophat is plotted in turquoise. Top right: Superimposed top-view cross-sections of PLASTIC. At the top, the entrance system is visible. At lower layers, the resistive anode and solid-state detectors are found. In purple we show the resistive anode channels, corresponding to the incident directions from the SWS aperture on the opposite side of the instrument. Bottom: Histograms of PLASTIC pulse-height analysis data from 2009. The left histogram shows the SSD energy channel as a function of the time-of-flight channel, wherein only events contribute that occur during energy-per-charge step 44. The dashed grey line shows the expected positions of He+ and He2+ for all energy-per-charge steps. The right histogram shows the energy-per-charge step as a function of time-of-flight channel. The dashed white line shows the expected average position of He+. The right histogram is normalised to individual maxima of time-of-flight slices.
Current usage metrics show cumulative count of Article Views (full-text article views including HTML views, PDF and ePub downloads, according to the available data) and Abstracts Views on Vision4Press platform.
Data correspond to usage on the plateform after 2015. The current usage metrics is available 48-96 hours after online publication and is updated daily on week days.
Initial download of the metrics may take a while.