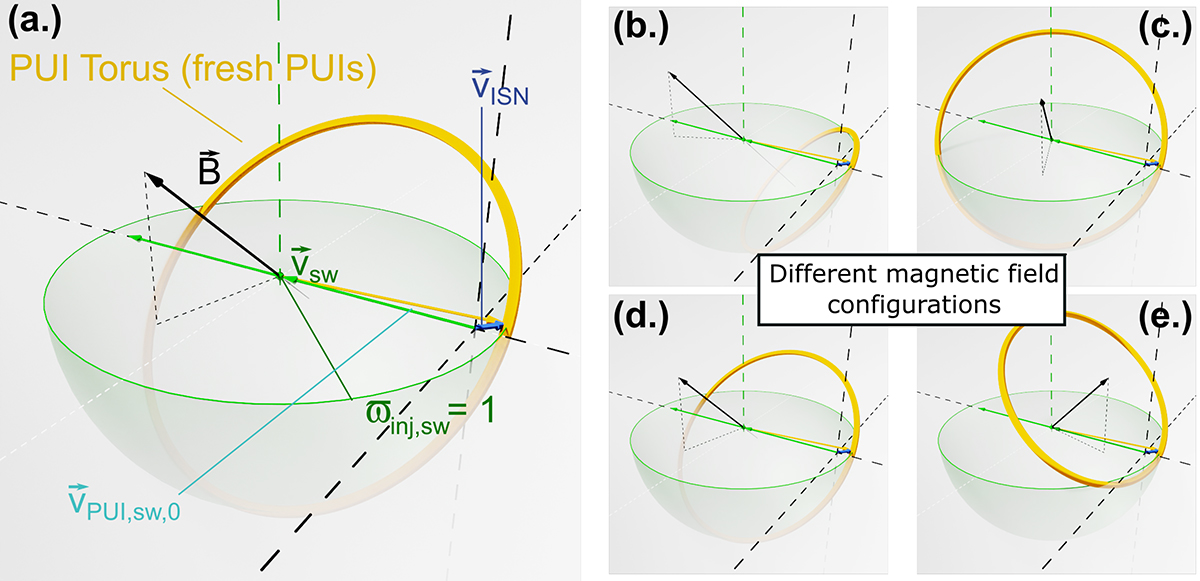
Fig. 1.
Download original image
three-dimensional (3D) visualisation of a freshly injected PUIs in velocity space in the SW frame of reference. The green arrows represent the SW bulk velocity, the black arrows show the local magnetic field, the blue arrows show the ISN velocity, and the amber ring shows the initial PUI VDF. The green hemisphere is a cut-out of the sphere of the entirety of velocities of fresh PUIs at the depicted setup of the SW velocity and ISN velocity. The different visualisations depict in total five different magnetic field configurations, and the other parameters are kept constant.
Current usage metrics show cumulative count of Article Views (full-text article views including HTML views, PDF and ePub downloads, according to the available data) and Abstracts Views on Vision4Press platform.
Data correspond to usage on the plateform after 2015. The current usage metrics is available 48-96 hours after online publication and is updated daily on week days.
Initial download of the metrics may take a while.