Fig. 6.
Download original image
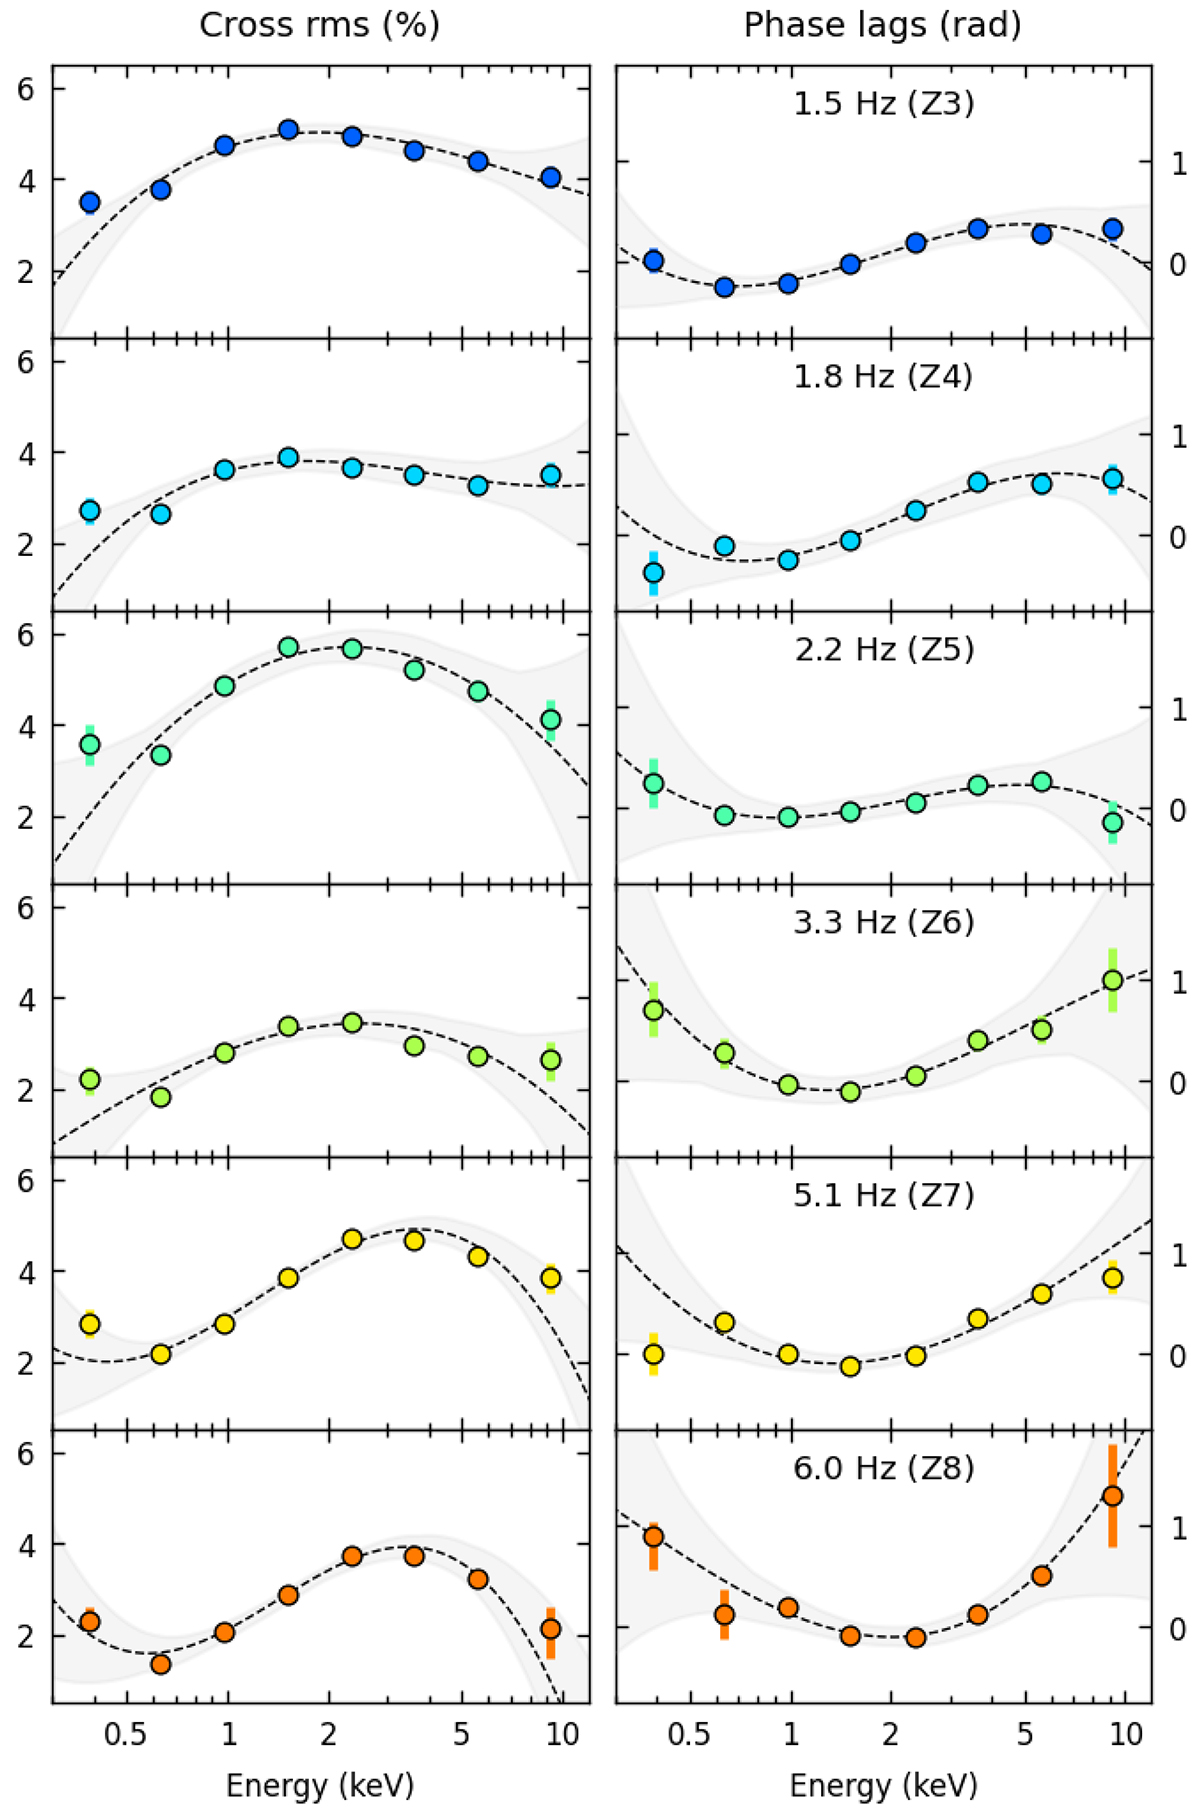
Covariance rms amplitude (in percent, left column) and phase lags (radians, right panel) of the imaginary QPO that cause the coherence drop of Cygnus X-1 as a function of energy. The centroid frequency of the imaginary QPO is indicated in each panel. A cubic polynomial has been fitted in each case to track the corresponding minima or maxima. In each panel, we show cubic model realisations in grey that depict the 1σ confidence range of the fits.
Current usage metrics show cumulative count of Article Views (full-text article views including HTML views, PDF and ePub downloads, according to the available data) and Abstracts Views on Vision4Press platform.
Data correspond to usage on the plateform after 2015. The current usage metrics is available 48-96 hours after online publication and is updated daily on week days.
Initial download of the metrics may take a while.