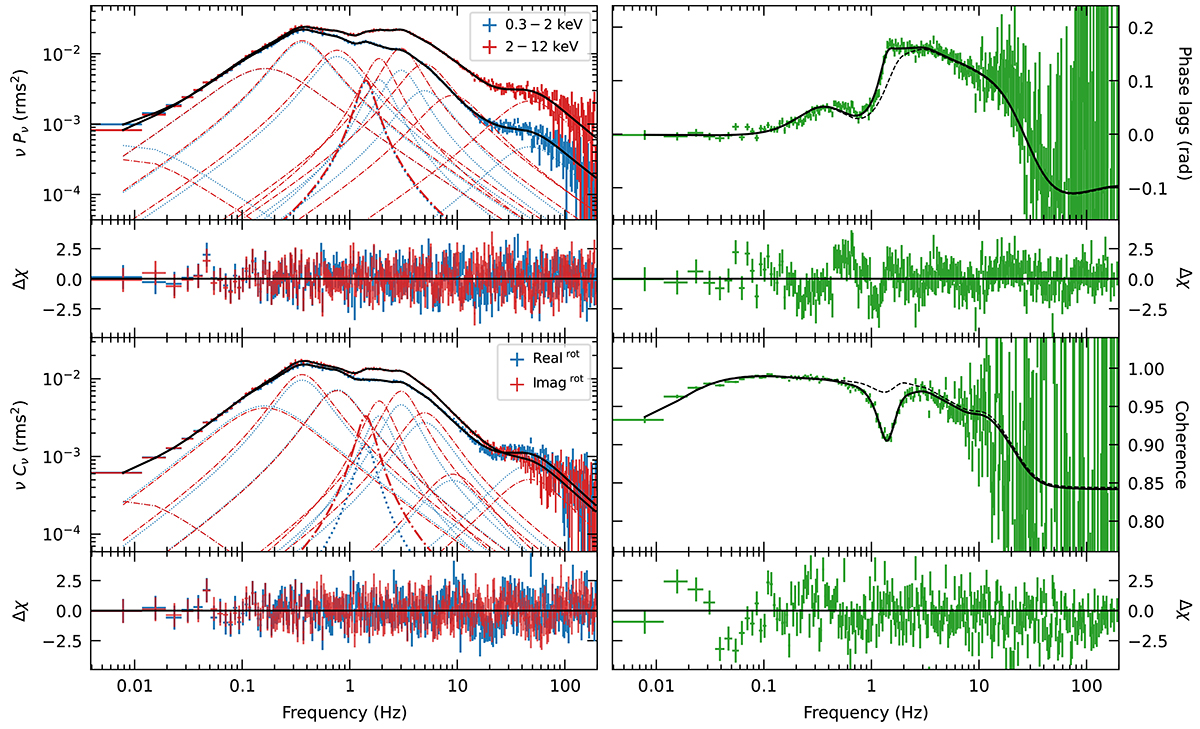
Fig. 5.
Download original image
Constant phase-lag model applied to region Z3 of the HID of Cygnus X-1. The top-left panels show the soft (0.3 − 2 keV) and hard (2 − 12 keV) PDS in rms2 units and residuals. The bottom-left panels show the real and imaginary parts of the cross spectrum (with the cross vector rotated by π/4) in rms2 units and the residuals. The top-right panels show the phase lags (rad) with the derived model and residuals. The bottom-right panels show the intrinsic coherence with the derived model and residuals. As described in the text, the model lines drawn in the right panels have not been fitted to the phase lags and the coherence but have been derived from the fits to the PDS and CS in the left panels. The QPO responsible for the coherence drop is highlighted over the other Lorentzians using a thicker line (at ν ∼ 1.3 Hz). The solid lines in the plots of the phase lags and coherence function show the derived model of those two quantities for ten Lorentzians (see text). Because the total phase lag spectrum and coherence function are not a combination of additive components, in these plots we cannot show the contribution of each Lorentzian. To show the effect of the imaginary QPO, the dashed lines in the plots show the derived models without the Lorentzian associated with the Imaginary QPO (without refitting the data).
Current usage metrics show cumulative count of Article Views (full-text article views including HTML views, PDF and ePub downloads, according to the available data) and Abstracts Views on Vision4Press platform.
Data correspond to usage on the plateform after 2015. The current usage metrics is available 48-96 hours after online publication and is updated daily on week days.
Initial download of the metrics may take a while.