Fig. 4.
Download original image
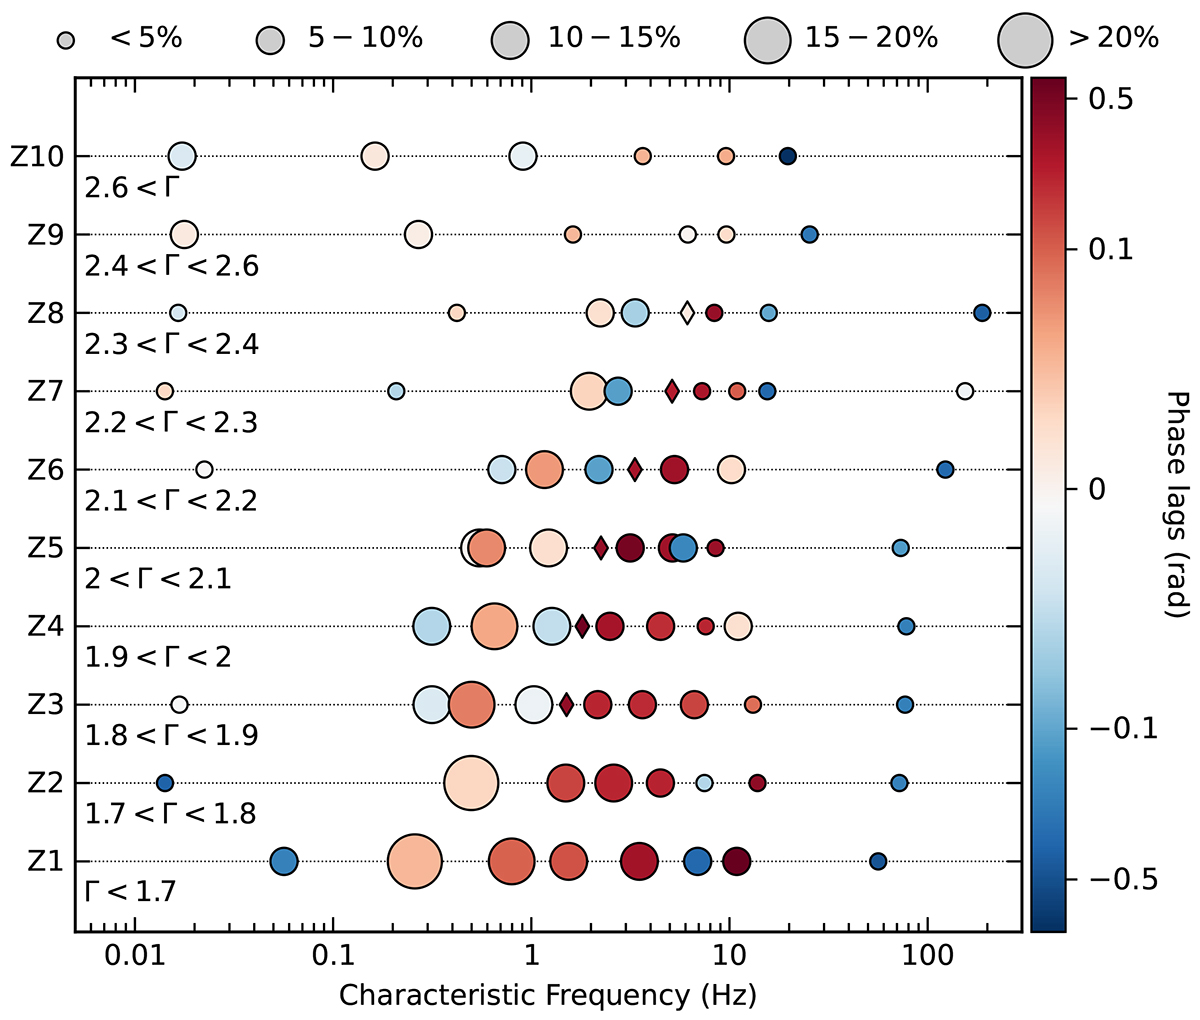
Bubble plot of every Lorentzian in each HID region (vertical axis) of Cygnus X-1 as a function of their characteristic frequency (horizontal axis). The area of each bubble is proportional to the covariance rms amplitude of the Lorentzian. The colour scheme indicates the corresponding phase lag. The diamond marker highlights the narrow QPO responsible for the sharp coherence drop, which becomes apparent in Zones 3 to 8, corresponding to intermediate states with 1.8 < Γ < 2.4.
Current usage metrics show cumulative count of Article Views (full-text article views including HTML views, PDF and ePub downloads, according to the available data) and Abstracts Views on Vision4Press platform.
Data correspond to usage on the plateform after 2015. The current usage metrics is available 48-96 hours after online publication and is updated daily on week days.
Initial download of the metrics may take a while.