Fig. 3
Download original image
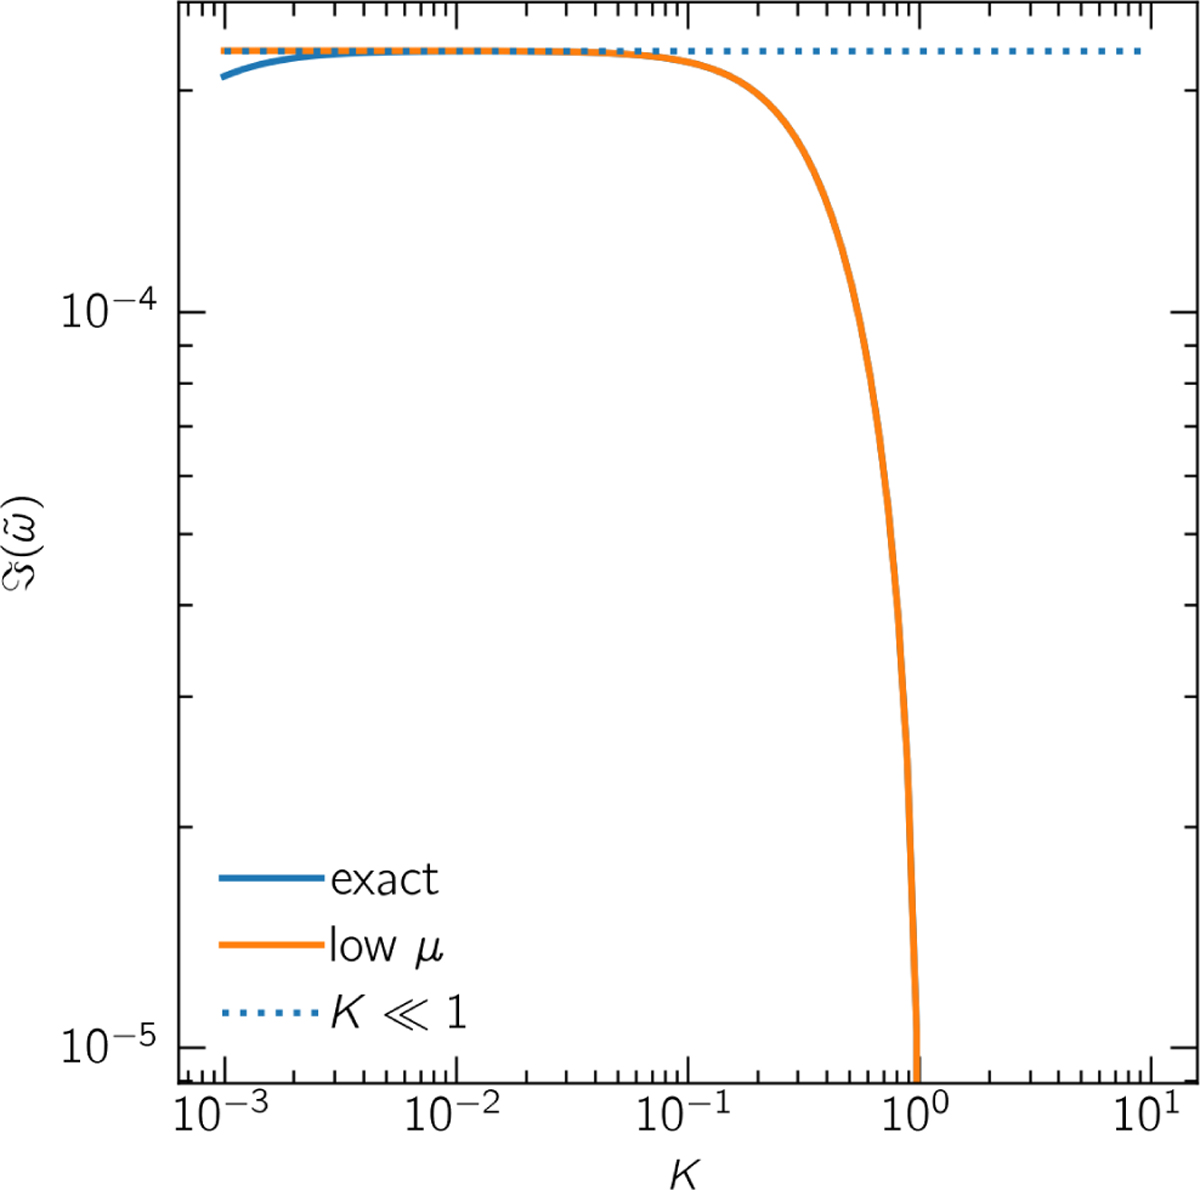
Growth rate for the backward propagating sound wave, with ω0 = −kcg, for μ = 0.001, smin = 0.5 and smax = 1.2. The solid blue curve represents the exact solution to Eq. (26), while the orange curve is the approximation (31) for μ ≪ 1, which overlaps with the blue curve everywhere except for K ≲ μ. The dotted line is the approximation (32) for small K.
Current usage metrics show cumulative count of Article Views (full-text article views including HTML views, PDF and ePub downloads, according to the available data) and Abstracts Views on Vision4Press platform.
Data correspond to usage on the plateform after 2015. The current usage metrics is available 48-96 hours after online publication and is updated daily on week days.
Initial download of the metrics may take a while.