Open Access
Fig. 8.
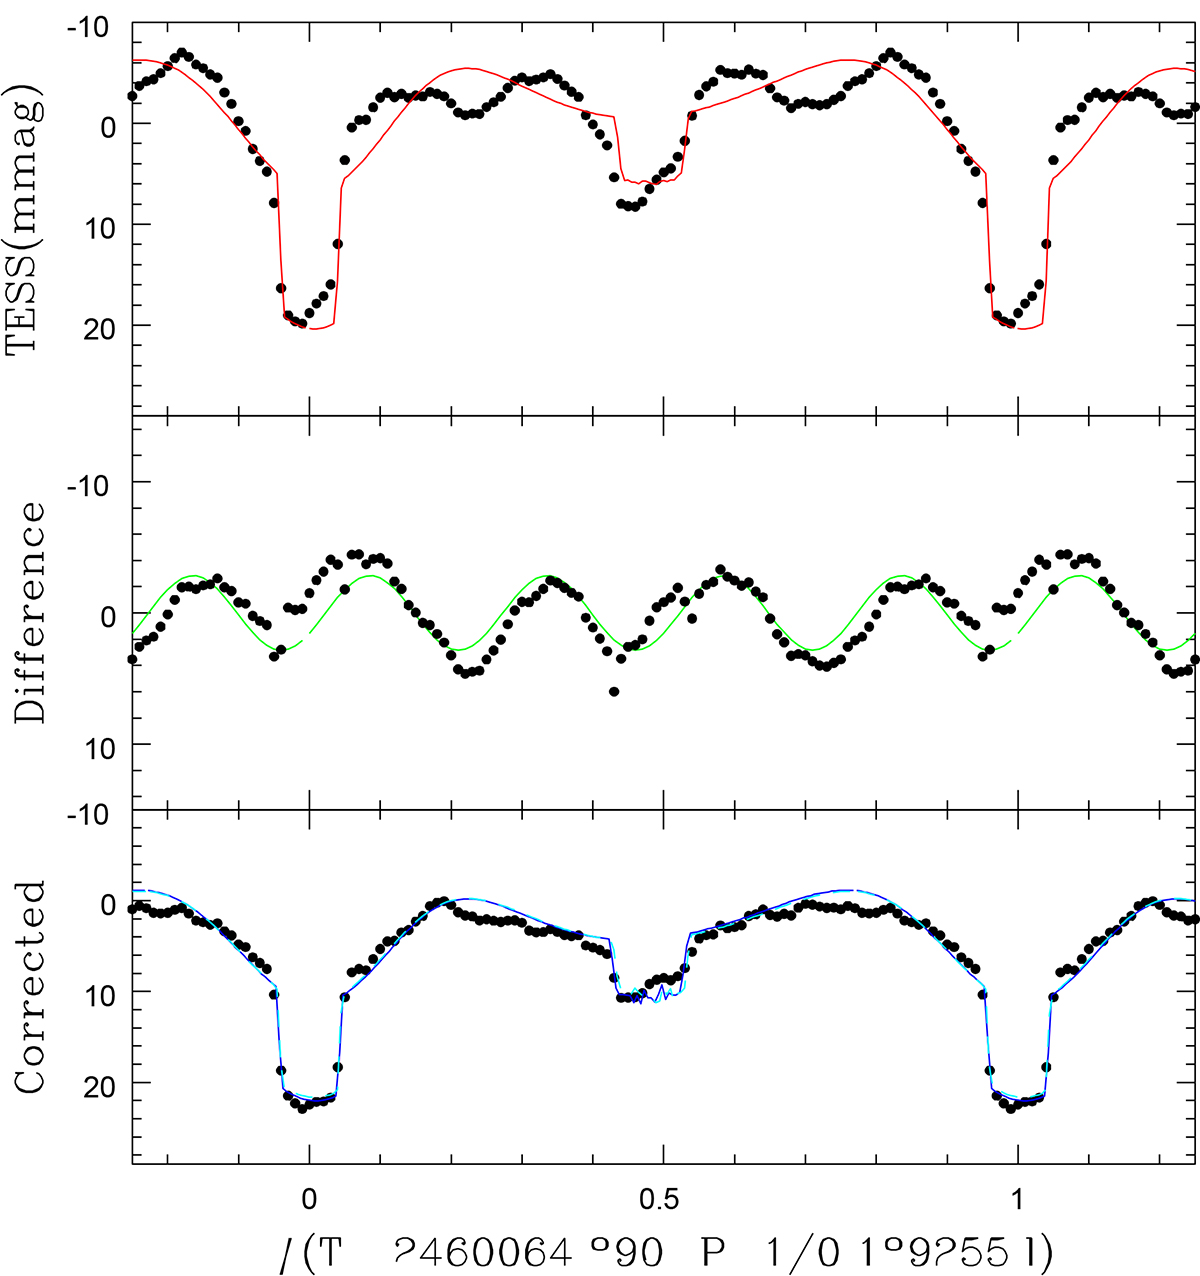
Download original image
Top: average light curve with the first best-fit photometric solution. Middle: residuals and their best-fit sine wave. Bottom: average light curve after removal of this sine wave, and best-fit photometric solution (solid blue line = supergiant solution, dashed cyan line = giant solution).
Current usage metrics show cumulative count of Article Views (full-text article views including HTML views, PDF and ePub downloads, according to the available data) and Abstracts Views on Vision4Press platform.
Data correspond to usage on the plateform after 2015. The current usage metrics is available 48-96 hours after online publication and is updated daily on week days.
Initial download of the metrics may take a while.