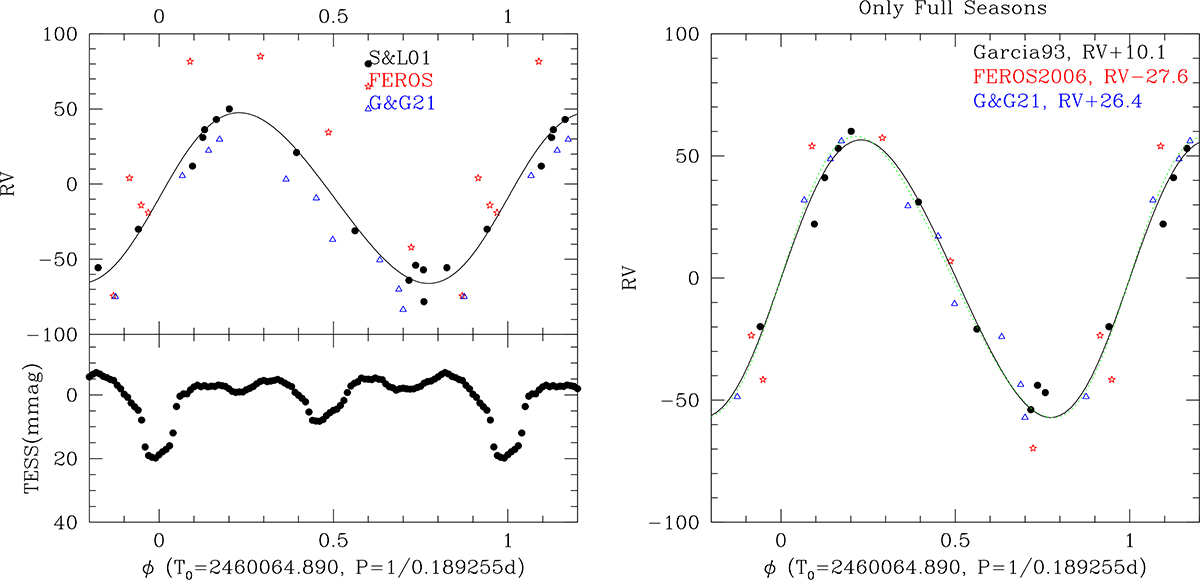
Fig. 3.
Download original image
Left: RVs of HD 96670 used by Stickland & Lloyd (2001: black dots), averages of the RVs derived by Gomez & Grindlay (2021: blue triangles), and RVs measured on FEROS data (red stars). The Stickland & Lloyd solution is also shown – beware that the period used by these authors was different. The bottom panel displays the average TESS LC, phased with the same ephemeris. Right: shifted RVs along with the solutions of Stickland & Lloyd (black line, with γ set to zero) and ours (dotted green line). Here, ϕ = 0 corresponds to conjunction with the O star in front and only the FEROS points from 2006 (marked with an asterisk in Table 1) are shown.
Current usage metrics show cumulative count of Article Views (full-text article views including HTML views, PDF and ePub downloads, according to the available data) and Abstracts Views on Vision4Press platform.
Data correspond to usage on the plateform after 2015. The current usage metrics is available 48-96 hours after online publication and is updated daily on week days.
Initial download of the metrics may take a while.