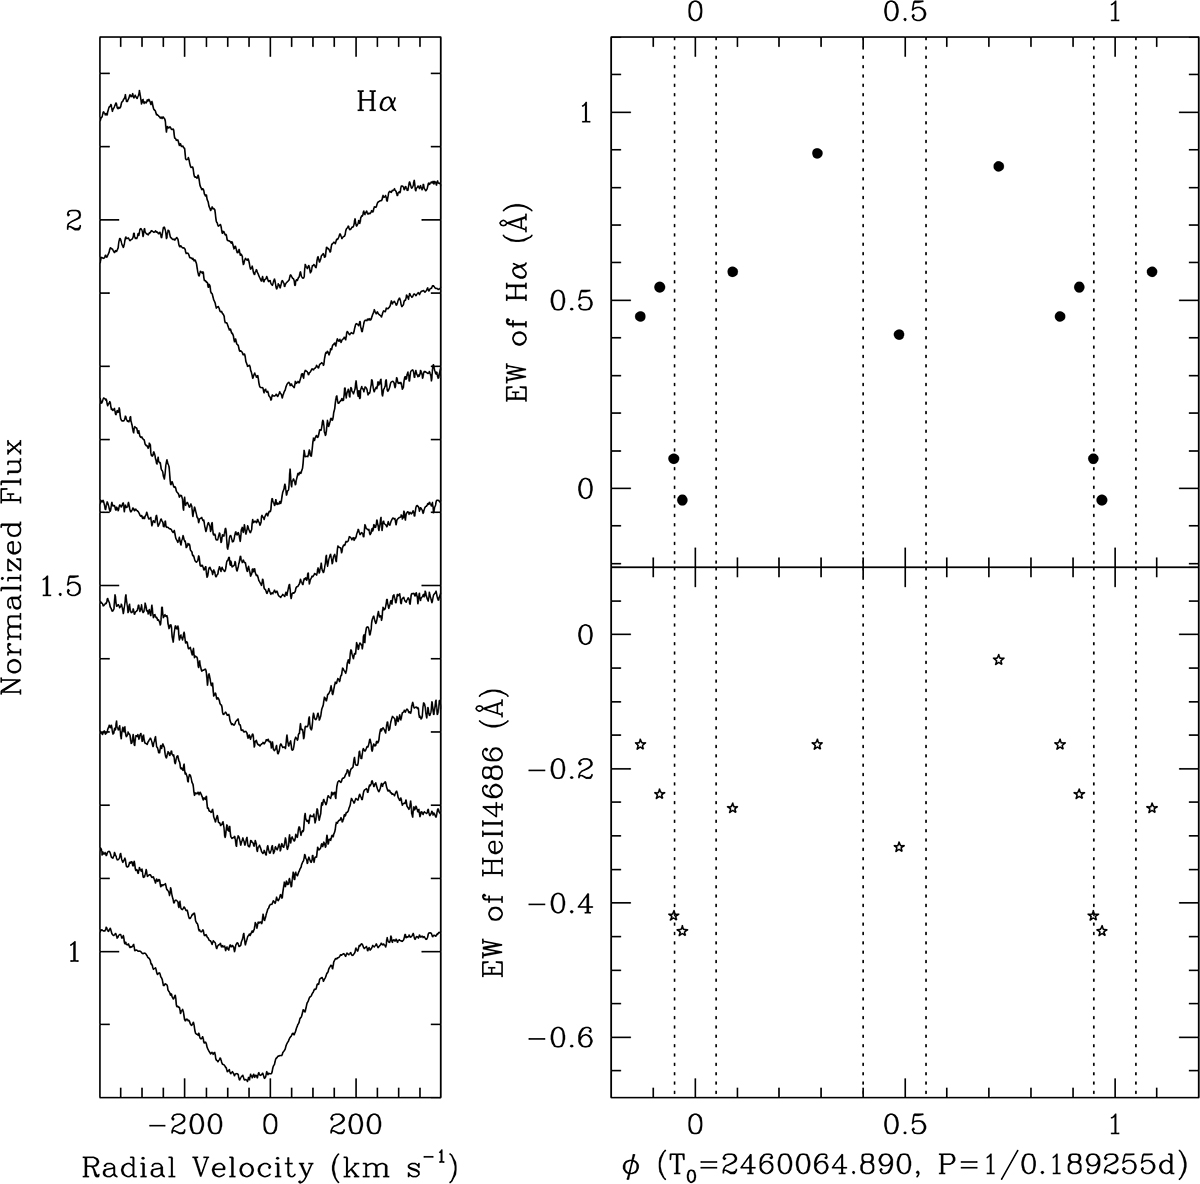
Fig. 11.
Download original image
Left: same as Fig. 1 for Hα. Time runs downwards (see Table 1 for exact dates); associated phases are, from top to bottom, 0.97 (2004 data), 0.95, 0.72, 0.92, 0.09, 0.29, 0.49 (2006 data), 0.87 (2009 data). Right: Equivalent widths of Hα (top, black dots) and He IIλ4686 Å (bottom, stars) as a function of phase. These EWs correspond to integration of the profiles in 6545.0–6575.0 Å and 4676.0–4693.5 Å, respectively. The vertical dotted lines correspond to the eclipse limits.
Current usage metrics show cumulative count of Article Views (full-text article views including HTML views, PDF and ePub downloads, according to the available data) and Abstracts Views on Vision4Press platform.
Data correspond to usage on the plateform after 2015. The current usage metrics is available 48-96 hours after online publication and is updated daily on week days.
Initial download of the metrics may take a while.