Open Access
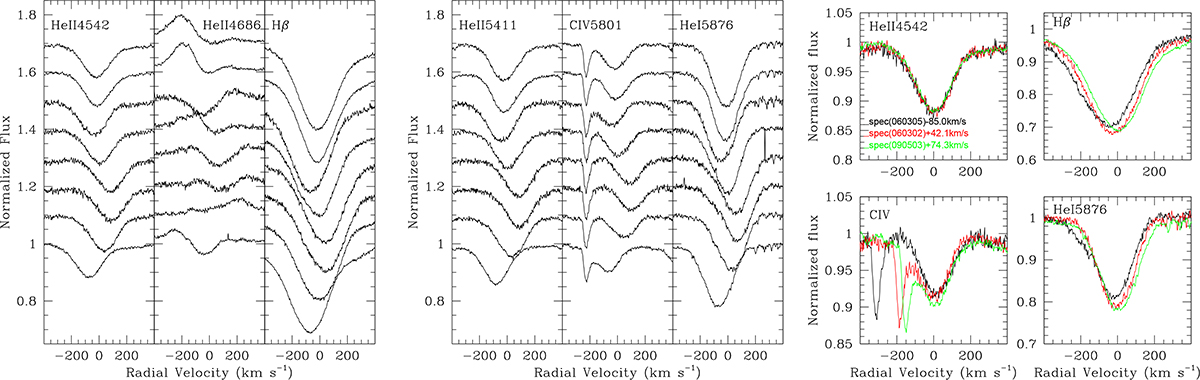
Fig. 1.
Download original image
Left and middle panels: various lines recorded in the eight FEROS spectra, with arbitrary vertical shifts to make differences clearer (oldest spectrum on top, earliest at bottom). Right: lines corrected for the average He II velocity (Table 1): He II and C IV display no profile change, while H and He I do.
Current usage metrics show cumulative count of Article Views (full-text article views including HTML views, PDF and ePub downloads, according to the available data) and Abstracts Views on Vision4Press platform.
Data correspond to usage on the plateform after 2015. The current usage metrics is available 48-96 hours after online publication and is updated daily on week days.
Initial download of the metrics may take a while.