Fig. 2.
Download original image
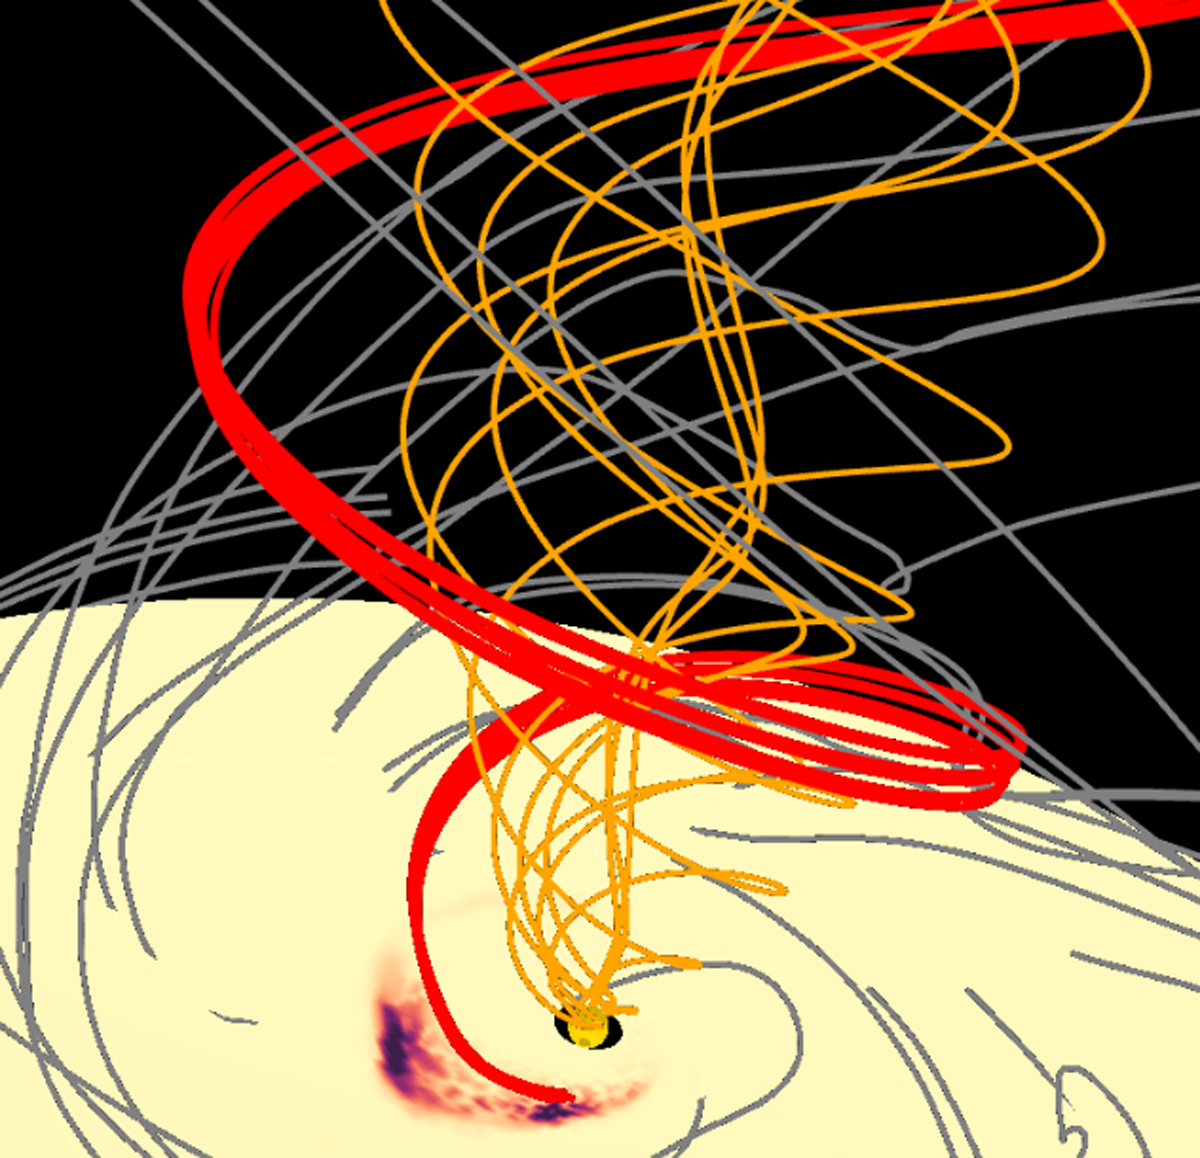
Three-dimensional representation of the accretion flow and magnetic field topology during a flux eruption event. The color in the equatorial plane corresponds to the product of the magnetization times the vertical magnetic field strength, divided by the gas pressure (σ × Bz2/Pg), highlighting newly generated flux bundles (red lines) created by the flux eruption event. The red field lines are drawn from the peak of the quantity plotted in color, corresponding to the most energetic part of the flux bundle. The gray lines represent the magnetic field lines of the accretion disk. The orange lines show the magnetized funnel field lines, which originates from the black hole and had been connected to the flux bundle before the event.
Current usage metrics show cumulative count of Article Views (full-text article views including HTML views, PDF and ePub downloads, according to the available data) and Abstracts Views on Vision4Press platform.
Data correspond to usage on the plateform after 2015. The current usage metrics is available 48-96 hours after online publication and is updated daily on week days.
Initial download of the metrics may take a while.