Fig. 9
Download original image
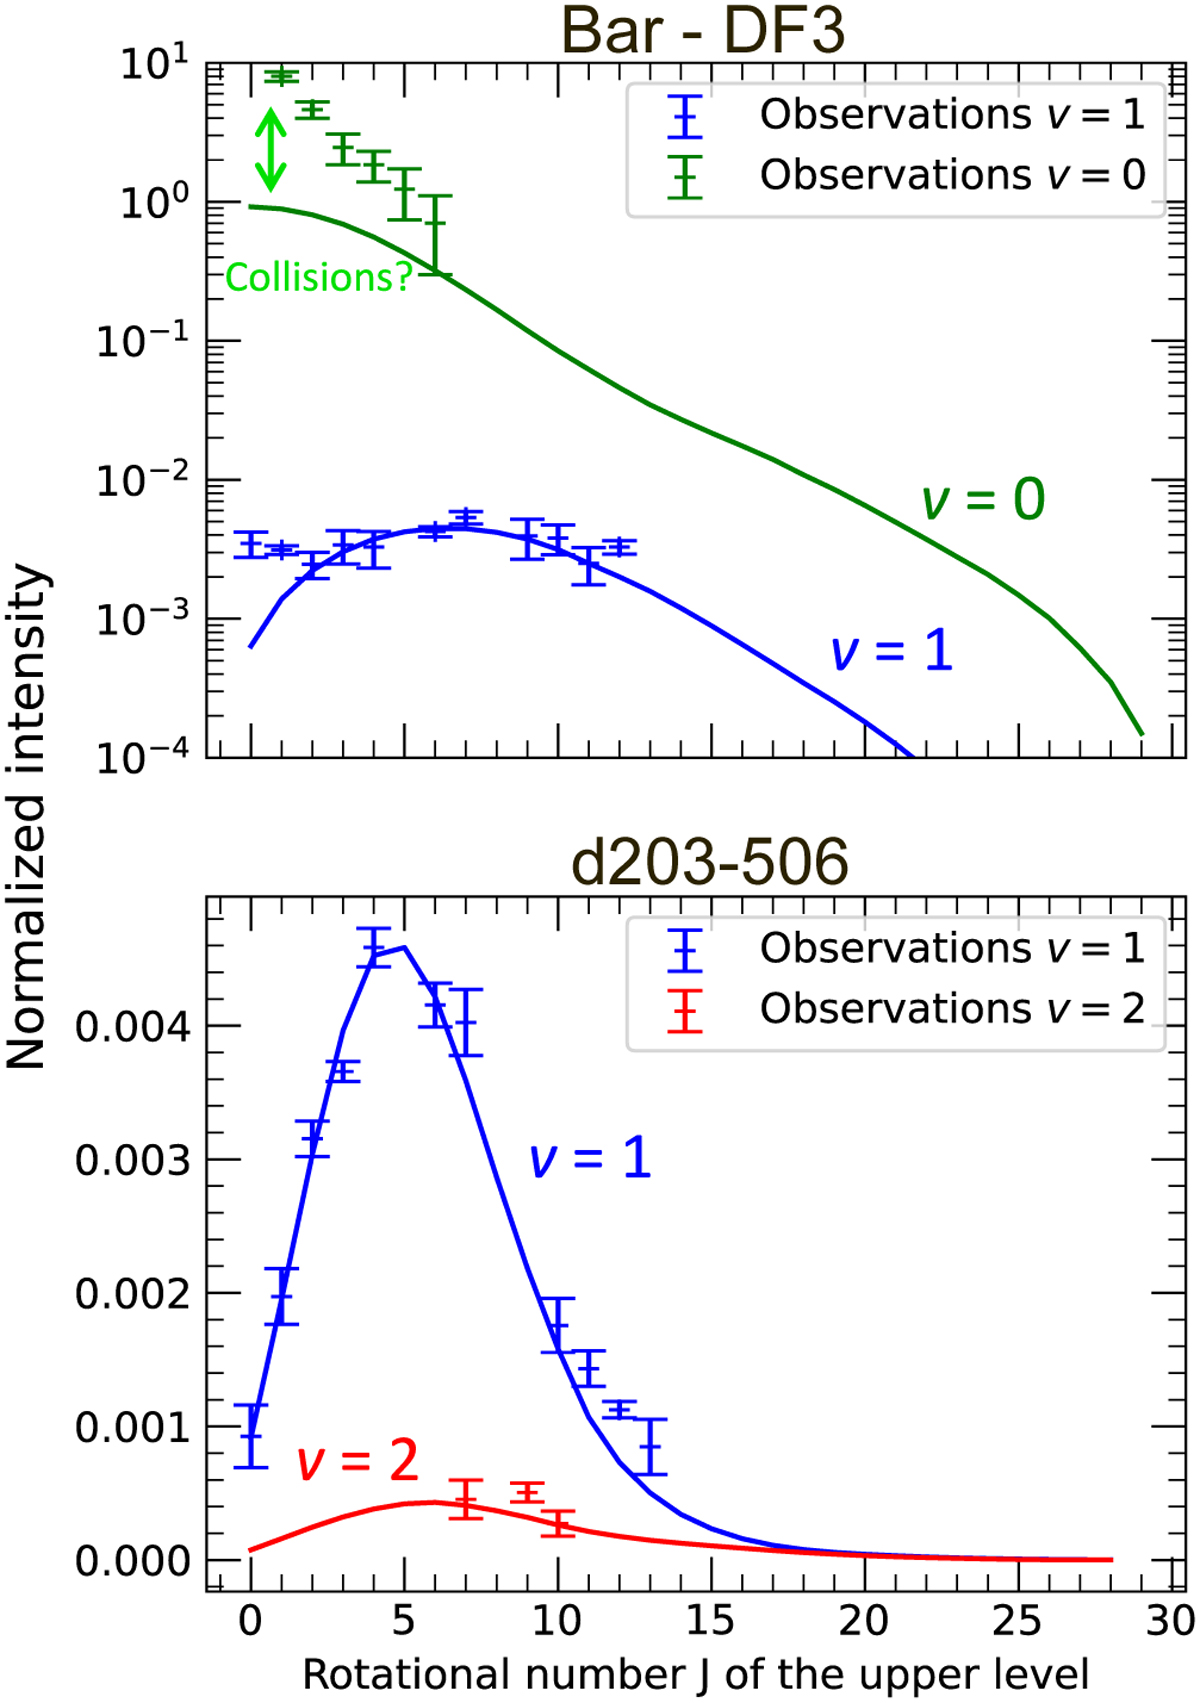
Normalized intensities Ĩij of CH+ of v = 0 → 0, J → J–1 (green), v =1 → 0, J → J + 1 (blue), and v = 2 → 1, J → J + 1 (red) following chemical-pumping while considering the observed population densities of H2 and temperature in the Bar and d203-506. Emissions from v = 1 and v = 2 levels are observed with NIRSpec. Emission from v = 0 levels are observed with Herschel/PACS and Herschel/HIFI, and we considered that the emission comes from a 2′′ wide filament (Joblin et al. 2018).
Current usage metrics show cumulative count of Article Views (full-text article views including HTML views, PDF and ePub downloads, according to the available data) and Abstracts Views on Vision4Press platform.
Data correspond to usage on the plateform after 2015. The current usage metrics is available 48-96 hours after online publication and is updated daily on week days.
Initial download of the metrics may take a while.