Fig. 3
Download original image
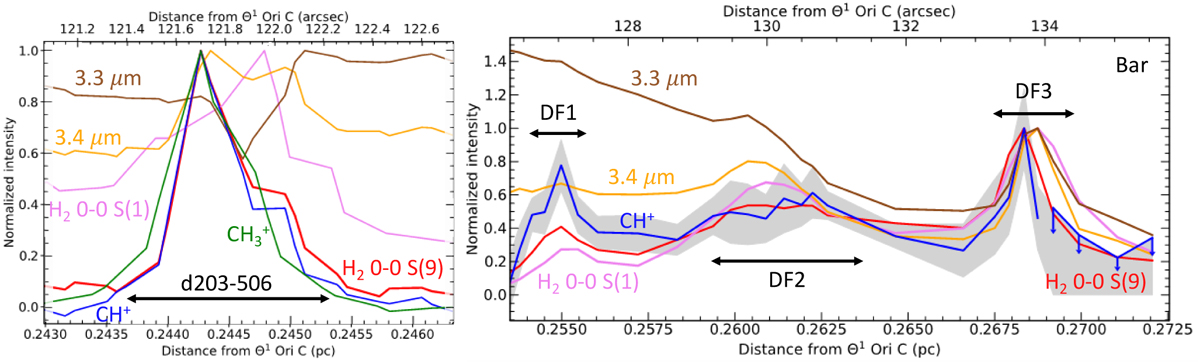
Normalized integrated intensity profiles of the CH+ v = 1–0 P(5) line, ![]() emission between 7.16 and 7.20 μm, H2 0–0 S(1) line, H2 0–0 S(9) line, and AIB emission at 3.3 and 3.4 μm (Left) across the protoplanetary disk d203-506 (Right) and across the dissociation fronts as a function of the distance to the star θ1 Ori C. The position of the cut through d203-506 is presented in Peeters et al. (2024). In the Bar, each point corresponds to the intensity averaged on apertures with width of 2′′ and height varying from 0.2′′ to 1.5′′ to increase the S/N. The maps used to derive the intensity profile of H2 lines (resp.
emission between 7.16 and 7.20 μm, H2 0–0 S(1) line, H2 0–0 S(9) line, and AIB emission at 3.3 and 3.4 μm (Left) across the protoplanetary disk d203-506 (Right) and across the dissociation fronts as a function of the distance to the star θ1 Ori C. The position of the cut through d203-506 is presented in Peeters et al. (2024). In the Bar, each point corresponds to the intensity averaged on apertures with width of 2′′ and height varying from 0.2′′ to 1.5′′ to increase the S/N. The maps used to derive the intensity profile of H2 lines (resp. ![]() emission) are presented in Zannese & Sidhu (in prep) (resp. Berné et al. 2023). The line 0–0 S(9) was chosen as its wavelength is close to the wavelength range of CH+ infrared rovibrational emission, so the comparison between the lines is less affected by extinction. CH+ and
emission) are presented in Zannese & Sidhu (in prep) (resp. Berné et al. 2023). The line 0–0 S(9) was chosen as its wavelength is close to the wavelength range of CH+ infrared rovibrational emission, so the comparison between the lines is less affected by extinction. CH+ and ![]() emission follows better the emission of excited
emission follows better the emission of excited ![]() than the emission of less excited H2 and the emission of AIBs.
than the emission of less excited H2 and the emission of AIBs.
Current usage metrics show cumulative count of Article Views (full-text article views including HTML views, PDF and ePub downloads, according to the available data) and Abstracts Views on Vision4Press platform.
Data correspond to usage on the plateform after 2015. The current usage metrics is available 48-96 hours after online publication and is updated daily on week days.
Initial download of the metrics may take a while.