Fig. 2
Download original image
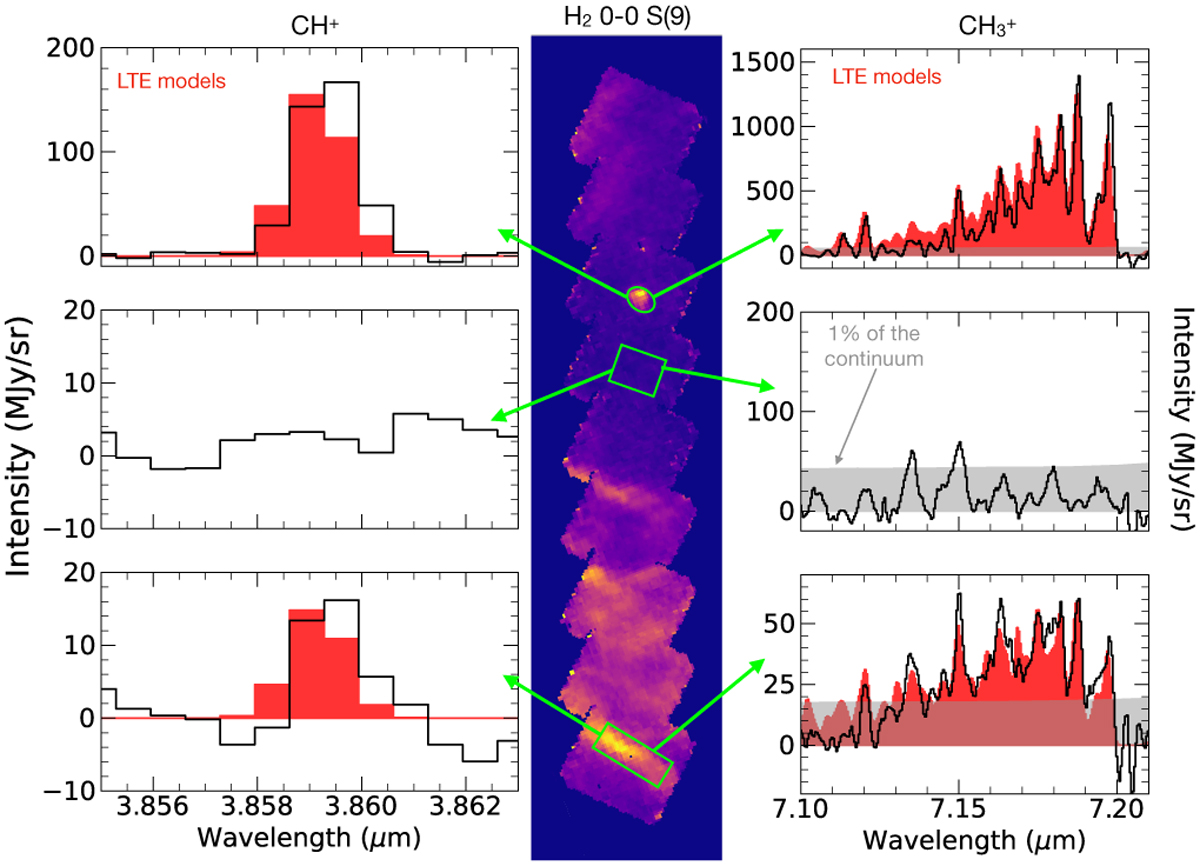
H2 0–0 S(9) continuum subtracted map at 4.69 μm (Zannese & Sidhu in prep). The green boxes are the aperture used to extract the spectra. (Left) CH+ v = 1–0 P(5) line at 3.86 μm. (Right) ![]() emission from the Q branch around 7.15 μm. The solid red graphs are LTE models adapted to the observations (see Sect. 5.1 and Figs. E.1 and E.2). The gray filling represents 1% of the continuum. This shows that CH+ and
emission from the Q branch around 7.15 μm. The solid red graphs are LTE models adapted to the observations (see Sect. 5.1 and Figs. E.1 and E.2). The gray filling represents 1% of the continuum. This shows that CH+ and ![]() are detected where H2 is bright and not where H2 is faint.
are detected where H2 is bright and not where H2 is faint.
Current usage metrics show cumulative count of Article Views (full-text article views including HTML views, PDF and ePub downloads, according to the available data) and Abstracts Views on Vision4Press platform.
Data correspond to usage on the plateform after 2015. The current usage metrics is available 48-96 hours after online publication and is updated daily on week days.
Initial download of the metrics may take a while.