Fig. F.2
Download original image
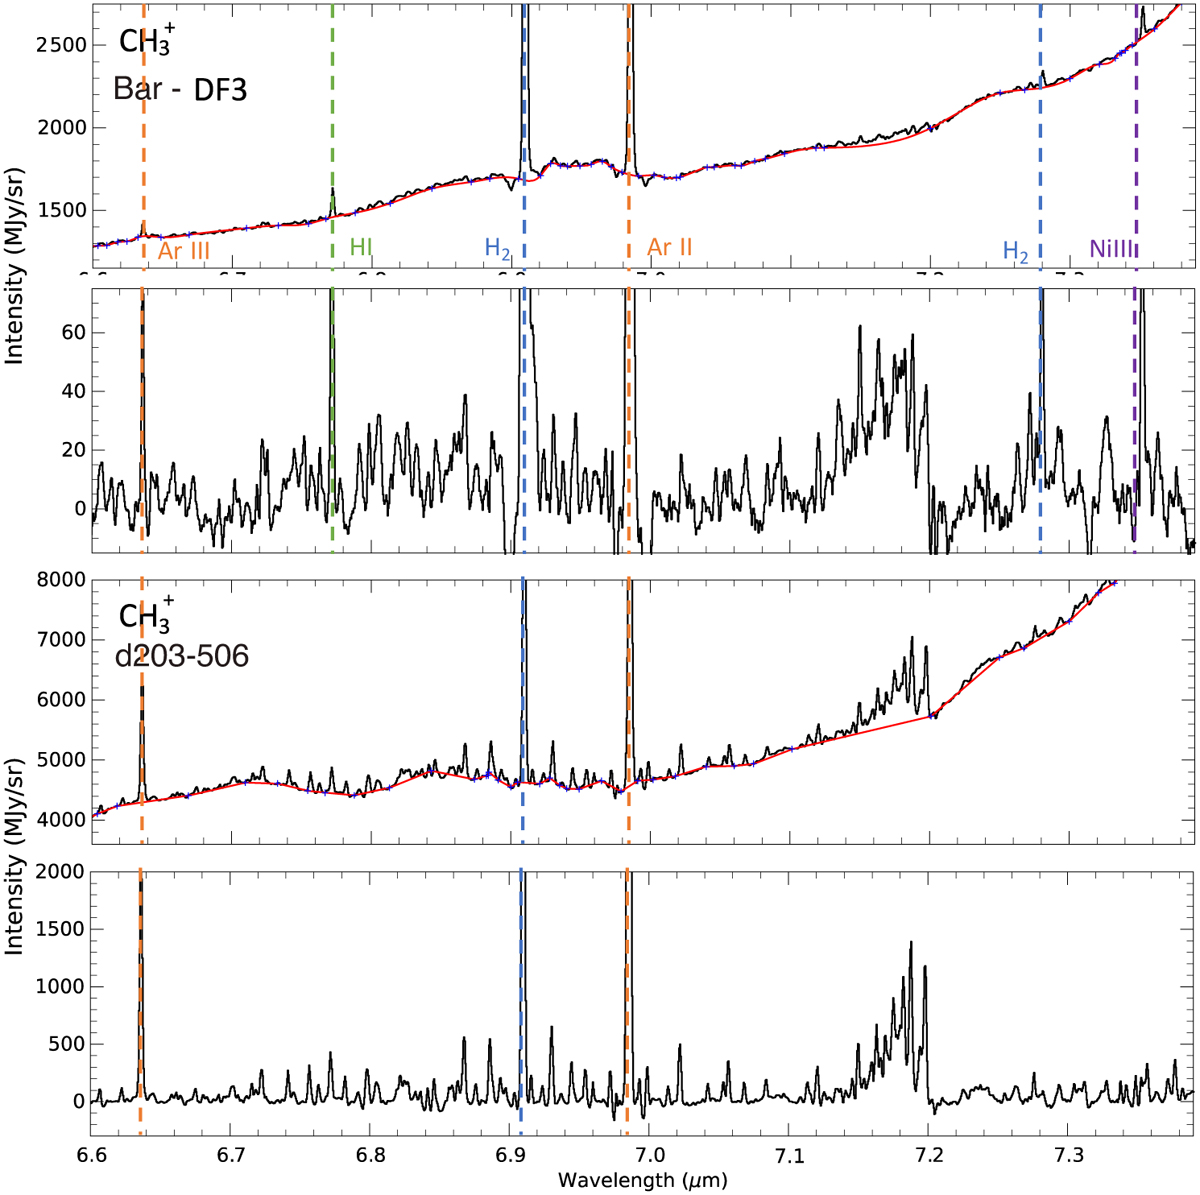
Processing of the MIRI-MRS spectrum. (a) DF3: (Top panel) Spectrum observed with MIRI-MRS. The red line is the estimated continuum. (Bottom panel) Continuum subtracted spectrum. (b) Disk: (Top panel) Spectrum observed with MIRI-MRS. The red line is the estimated continuum. (Bottom panel) Continuum subtracted spectrum. All the observed lines are from ![]() except for the highlighted ones. The identifications are made using Van De Putte et al. (2024).
except for the highlighted ones. The identifications are made using Van De Putte et al. (2024).
Current usage metrics show cumulative count of Article Views (full-text article views including HTML views, PDF and ePub downloads, according to the available data) and Abstracts Views on Vision4Press platform.
Data correspond to usage on the plateform after 2015. The current usage metrics is available 48-96 hours after online publication and is updated daily on week days.
Initial download of the metrics may take a while.